As reported above ... that line has to do with the day's precipitation. Please confirm for me that you do hae the right driver ... this one requires a Personal Weather Station and you running Weather-Display software to collect our station's data and then uses it's JSON file to report from. Do you meet those requirements?
I'm sorry but I don't know what you're asking, however, I went back and looked at the driver and I see it was the wrong driver. It was the one that required the PWS. I went back to Github and found the driver that did not require a PWS. I'll try that. I'm very new to all this and just trying to see if it can work for me. Thanks for any guidance.
Yes, this driver will not work without your own Personal Weather Station and running Weather-Display software. There is a warning about this at the top of the very first post. There is also a link to another driver for Dark Sky data that does NOT require a PWS. Try that one.
Don't know how/why I installed the wrong driver. The Requirements are written plain as day. So glad you let me know. Easy fix and all is good. No more errors, at least for now. Thanks!
1 Like
[UPDATED]
V4.3.3
10/13/2019
- Correction for forecastIcon and weatherIcon to use the 'standard' legacy WU codes that most dashboards use.
- Tweaked lux (illumination) for 'fully nighttime' to force it to 5 lux with no further cloudCover adjustments (it was setting to 5 and then further adjusting for cloudCover after that before).
[UPDATED]
V4.3.4
10/14/2019
- Added meters per second (m/s) as a selection for wind/wind gust speed.
- Added hectopascal (hPa) as a selection for pressure.
- Added the ability to use Dark Sky for wind reporting instead of your weather station (my anemometer just quit reporting and I need to replace it
 )
)
[UPDATE]
V4.3.5
10/22/2019
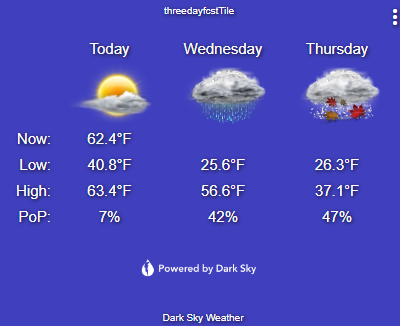
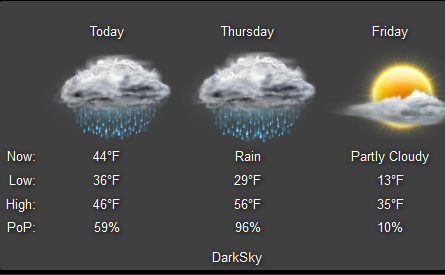
- Added three day weather forecast dashboard tile.
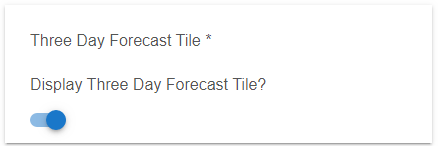
You must turn 'on' the Optional Attribute to use this:
Then in your dashboard select your device, then the 'attribute' template, then the 'threedayfcstTile' attribute:
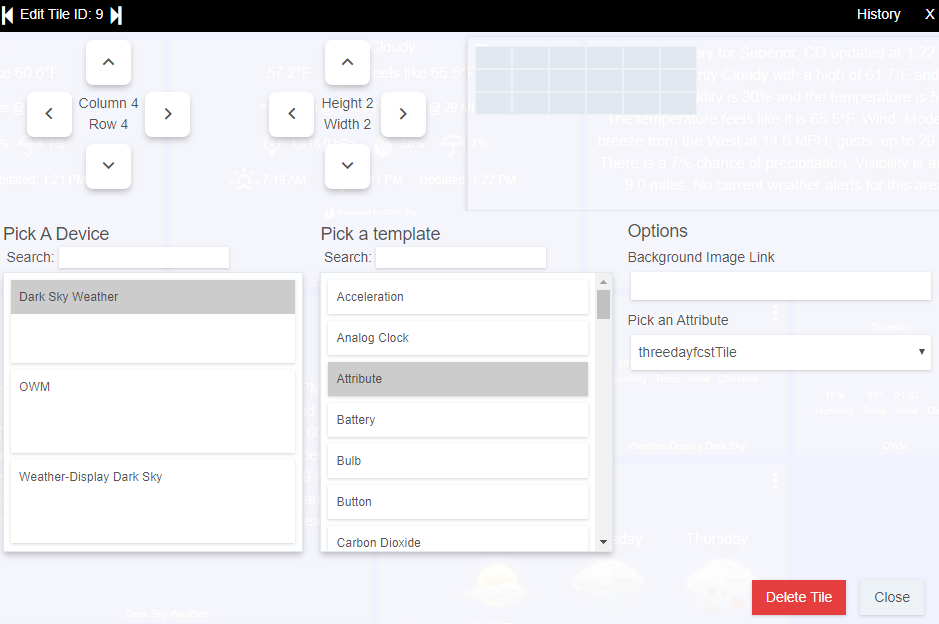
There you go....
1 Like
VERY MINOR UPDATE (I did NOT increment the version number)
Updated added at 5:10 PM EST so re-copy code if you copied before then.
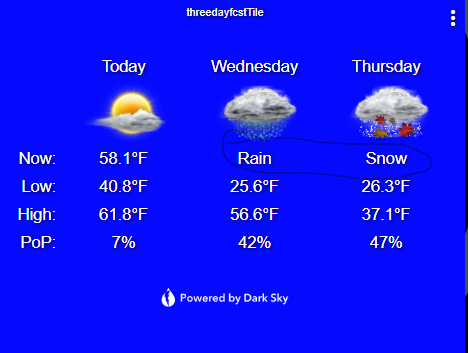
- Added 'forecast_text' to the two forecast days.
[UPDATE]
V4.3.6
10/22/2019
@alphaville21a14 pointed out an error in the data type for 'pressure'
- Corrected 'pressure' to be a number (it was a string with formatting).
- Added 'pressured' to replace the formatted pressure for those that want the formatted string.
[UPDATED]
V4.3.7
10/23/2019
- Minor tweak to force the icons for the two forecast days in the 3 Day Forecast Tile to be 'daytime' icons (instead of 'nighttime').
Also ... before the requests come in ..... I looked at 5 Day Forecast Tile. The amount of data and formatting in almost all cases exceeds the Dashboard Tile's maximum character length of 1024 characters. In my testing I also found that I needed to put in additional checks for the character length on the 3 day tile to prevent it 'trimming' off required closing html formatting if the string exceeds 1024 characters. Now if that happens it will just display a message that the data exceeds the maximum character length and it will not show any forecast. This prevents unintended consequences of un-closed html formatting from impacting the rest of the dashboard or 'Current State' display.
Matthew,
I'm using the latest driver and receiving this error:
My current Display Unit Date-Time Format = dd/mm/yyyy 12 hour (am|pm)
I do have Weather Display.
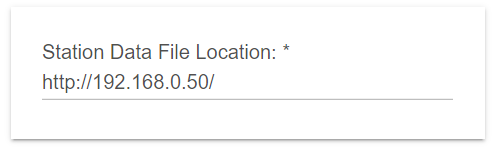
@CurtisZM. Nothing has changed there? That is the first data pulled from the WD JSON file. I would guess that the JSON file is either not available, or there is an issue with the creation of that file. Can you confirm that you can access the file directly on a web browser? It should be:
${pollLocationStation}everything.php where "${pollLocationStation}" is the location you specified in the preferences:
Matt,
When I opened everything.php from the browser, it started working again with no errors. Must have been goofed up. Don't know.
1 Like
[UPDATED]
V4.3.8
11/11/2019
- Corrected that 'feelsLike' was not being updated unless one of the optional dashboard selections was made.
1 Like
[UPDATED]
V4.3.9
12/15/2019
- Suggested change from @nh.schottfam (Thanks!
 ) to fix 'pressured' definition (the string version of the barometric pressure) to avoid excess events. This creates no visible change, just better efficiency.
1 Like
Really like the Three Day Forcast, but I just could not deal with 10ths of a degrees when temperatures are displayed in F on my old small screen cell phone display device. So I modified the code to show whole rounded degrees F, and eliminated the Icon and text. The changes I made also impact the mytile attribute that I originally created on APIXU.
Kindly adjust all fahrenheit temperatures and wind speeds in MPH to whole numbers. Should there be an objection to removing the tenths for these settings, add new settings for F (Rounded) and MPH (Rounded)
It would also be nice to see forcasted wind speeds on the three day forcast. Looks like there is sufficient real estate available
Code change was simple,, example follows:
updateDataValue("forecastHigh1", (tMetric=="°F" ? (Math.round(ds.daily.data[1].temperatureHigh.toBigDecimal() * 10) / 10) : (Math.round((ds.daily.data[1].temperatureHigh.toBigDecimal() - 32) / 1.8 * 10) / 10)).toString())
to
updateDataValue("forecastHigh1", (tMetric=="°F" ? (Math.round(ds.daily.data[1].temperatureHigh.toBigDecimal())) : (Math.round((ds.daily.data[1].temperatureHigh.toBigDecimal() - 32) / 1.8 * 10) / 10)).toString())
Glad you were able to modify to your liking. I will put on the wish list adding an option to select the number of decimal places displayed.
1 Like
[UPDATED]
V4.4.0
02/23/2020
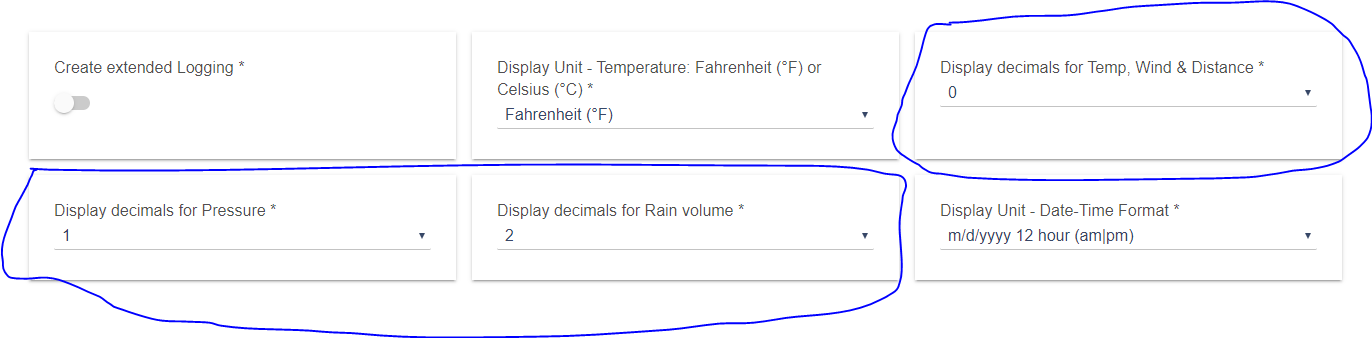
As requested by @arnb (and several others over time), added the ability to select the number of decimals shown. There are three groups i) Temperature, Wind Speed & Distance, ii) Pressure, and iii) Rain volume. Each can be set indepently of the others. You may choose to display from none (0) to four (4) decimal places, although I am not certain any data sources provide that level of detail.
1 Like
[UPDATED]
V4.4.1
02/24/2020
As requested by @arnb (and several others over time), added the ability to select the number of decimals shown. There are three groups i) Temperature, Wind Speed & Distance, ii) Pressure, and iii) Rain volume. Each can be set indepently of the others. You may choose to display from none (0) to four (4) decimal places, although I am not certain any data sources provide that level of detail.
This version corrects a bug introduced in V4.4.0 that made some numeric attributes strings.

