That's a slippery slope...![]()
I try to keep track of the requests in the second post of this topic. Not very efficient, I know, but it helps me not forget things.
Don't know how this can be implemented, but it would help me to discover the creative ways that folks use the app and what limitations they hit.
For my personal usage, the app is pretty feature-complete, but I have a limited set of device types and usage scenarios; I have my horse-blinders on ![]()
@thebearmay and @dandanache
I have a similar issue as @Sebastien but mine has not fixed itself. The two issues are:
-
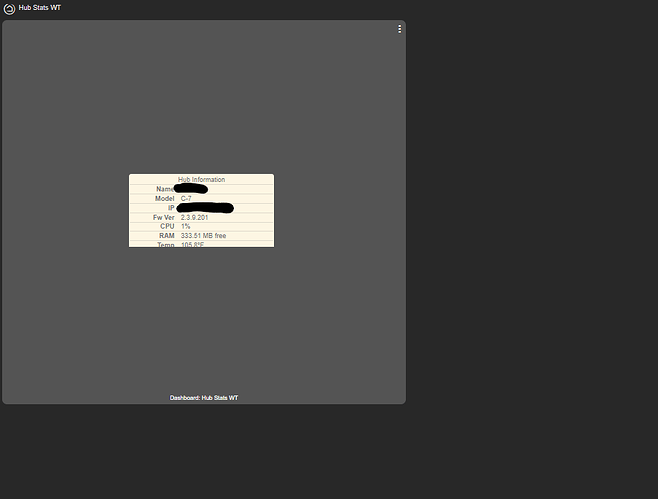
Hub stats WT dashboard starts in the far upper left corner, includes the Hub stats box and 2 graphs of equal width to the hub stats box below it, but in the HE native dashboard it displays only part of the Hub stats box, in
a large gray field, like this:
-
Similar to the above, all WT dashboards, when brought into HE, have extra gray background, either to the left or right, or below the WT tiles. This is the case even if the WT tiles fill the entire screen on WT.
I have the iFrame settings at width:100%;height:100%;border:none;
Released version 2.6.0 with the following small new feature:
Added
- Add support for chart User Scripts
Instead of me adding buttons and switches in the UI, you now have direct access to the Charts.js configuration object.
You can customize pretty much everything with how charts look like; you just have to write little bits of JavaScript and learn about Chart.js, easy right? ![]() Luckily, their documentation is very good.
Luckily, their documentation is very good.
Check out the Readme file to learn how to use this feature and find some simple examples.
@Sebastien this should help you solve the chart alignment issue.
Have fun!
What does your File Manager show for free space?

Sorry. I should have mentioned it. This is on a C-8 Pro.
I suspected that wouldn't be the issue. I have seen the message occur when multiple apps are accessing the same file; other than the Watchtower app do you have any other apps (or multiple instances of Watchtower) or rules running against those files?
See this topic for more on the file system errors:
No. Nothing else access those files. I do have Hubigraphs running and updating other files on the File System
That will do it. They both are triggered at the start of the minute/hour.
Yes, I now see the Watchtower errors all happen at the start of the hour and I know my Hubigraphs Long Term Storage all run at the same times. Not always do they collide but a couple of time a day.
Thanks @tj4293
I was able to change the Hubigraphs Long Term Storage jobs to 2 minutes after the each hour and I hope this will work.
Released version 2.7.0 with the following change:
Added
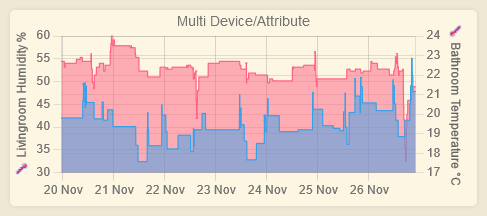
- Add Multi Device/Attribute tile type - @user3666
With the new tile type, you can chart multiple attributes from multiple devices. The ultimate flexibility ![]()

Have fun!
Amazing! Will revert w/ any feedback!
Is there any way to have the Dashboards be children of the app?
Is there any way to have the Dashboards be children of the app?
Sorry, no. I stayed away from the app parent/child paradigm on purpose, as I'm not very fond of it.
Released version 2.8.0 with the following changes:
Added
- Add Stats tile type
Changed
- Use drag-and-drop to re-order datasets when configuring "Multi Device/Attribute" and "Status Map" tile types
- Tech stack: don't use shadow dom anymore; minify HTML/CSS
Fixed
- Dashboard tiles can now be resized and moved on touchscreen devices -
@Sebastien
The new "Stats" tile type:
Have fun!
Dashboard tiles can now be resized and moved on touchscreen devices -
@Sebastien
Wow! Works perfectly. Thank you!
Add Stats tile type
Thanks for this!
Makes it real easy to get a reference at a quick glance.
A minor thing, but is there a way for tile value to be selected to the different average attributes?
One of my charts is for a voltage value that bounces around a bit over the short term.
i.e.
The following time resolution are used:
- 5 minutes: Attribute value in the last 5 minutes
- 1 hour: Average attribute value over the last hour
- 1 day: Average attribute value over the last day
- 1 week: Average attribute value over the last week


