HundredGraphs.com has finally got to the Hubitat. If you don't know, HundredGraphs is the service for logging and making graphs for Smart Homes. We mostly angled towards energy collection, however you can log and graph anything you want.
The basic FreeForever account is, duh, free.
However if you want to have longer retention or submit data with less than 10 mins interval between events, you would need a paid account.
To celebrate our new addition we would like to give you a discount.
If you are to get yearly subscription use hubitat12 as your code and you have almost 50% off. The number of discounts is limited though.
The forum software (Discourse) won’t allow brand new users to post links or images as a spam-prevention measure. You’ll have to participate in the community a bit to gain the sufficient user privileges.
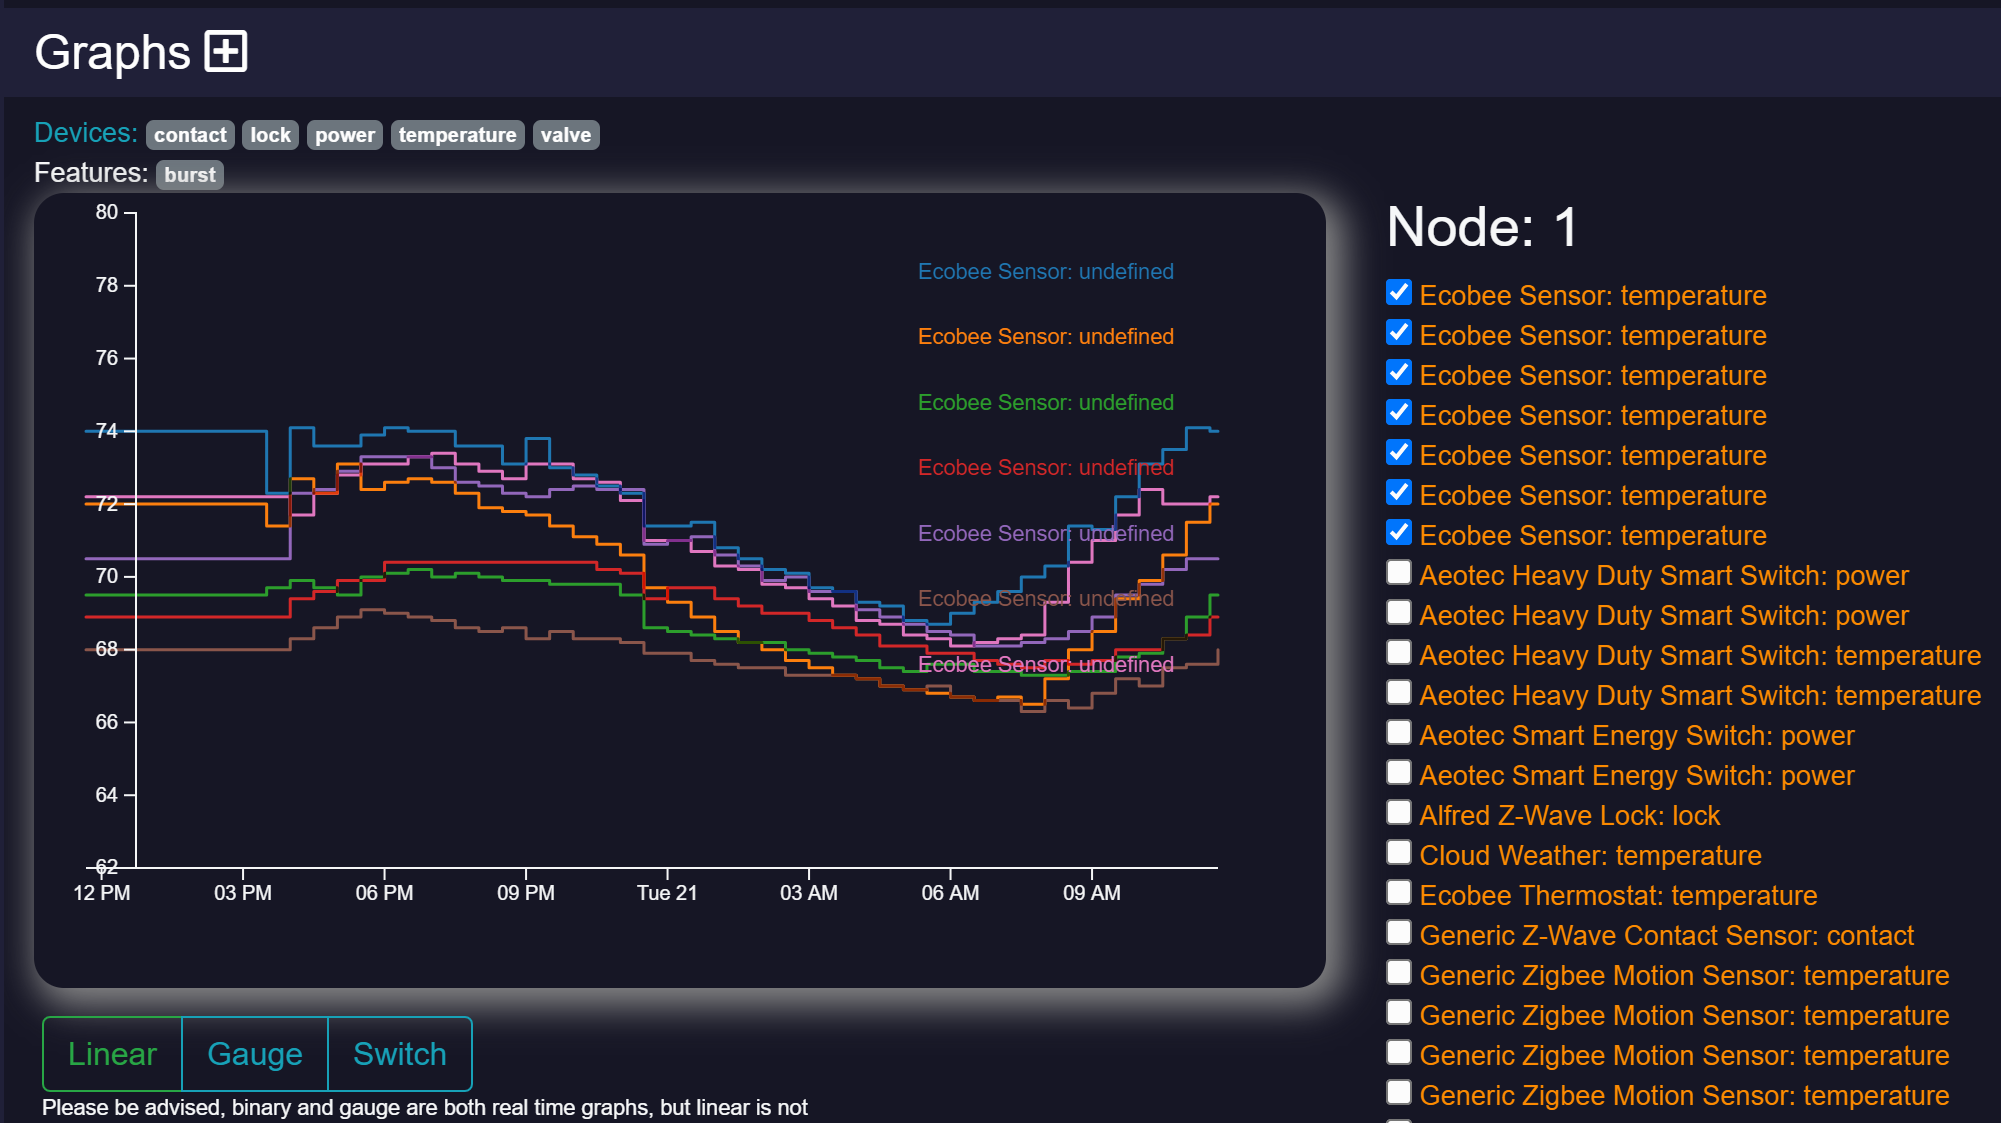
So I've installed this and got it working alright, however a big problem I have with it is it only displays Hubitat "device names", not "device labels". As Hubitat only prompts you to change the device label when adding devices, not the name, many of my devices have the same name. The name is set by the device driver, and usually denotes the type of sensor it is, while the label is the real identifier for each sensor. Because of this, all the graphs generated in HundredGraphs have a meaningless legend by default:
I see that I could rename each sensor in HundredGraphs, or I know I could update all the names in hubitat (although I prefer for the name to show the type of sensor), but I have quite a few sensors, and it would be much easier if hundred graphs just pulled the device label! Ideally it should be able to pull both name and label, and I feel for most users, the label should be the primary identifier for the data, while the name should be a secondary attribute (sensor type)
Yes, there are users with Hubitat plugin.
As for now you can see graphs only online. The hubitat hub itself is not powerful enough to run real-time graphs
Hi Stan, I am feeding thermostat operating state to Hundred Graphs. These are string values, not numeric, like "idle", "cooling", etc. Is there a way to translate these into numeric values, so I can graph them?
Right now, the values are feeding in as 0's and -1's.