Im working on a larger battery list, and custom battery options.
I'll have a new update out tomorrow, with this added. ![]()
Im working on a larger battery list, and custom battery options.
I'll have a new update out tomorrow, with this added. ![]()
Hey everyone,
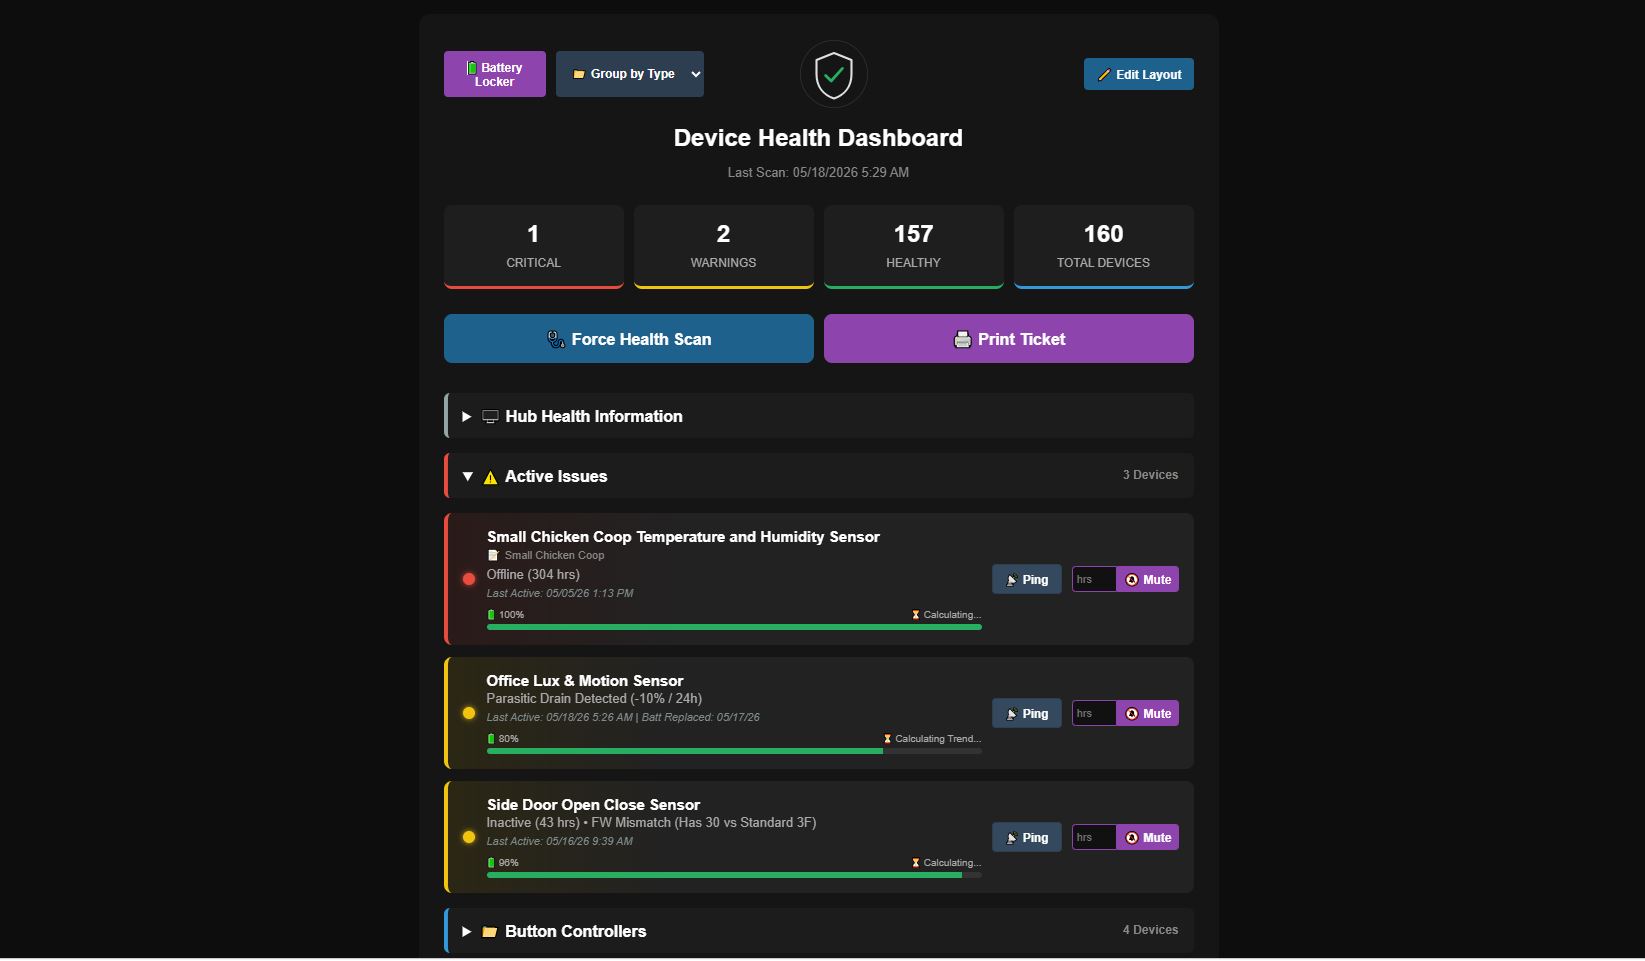
I’m happy to share the release of Version 1.5 of the Advanced Device Health Monitor.
Over the last few weeks, the main focus has been to keep our ecosystem of Advanced apps on the same page, bringing this health monitor up to the same standard of performance, automation, and usability as the rest of the lineup. We wanted to move beyond rigid global thresholds and static lists, offering a more dynamic and responsive way to manage your smart home infrastructure.
Here is a detailed breakdown of what is new and improved in v1.5:
Generating a massive HTML document for 200+ devices occasionally caused 504 or 403 Gateway timeouts when accessed remotely via the Hubitat Cloud. To fix this, the architecture has been completely refactored.
Outdoor sensors often experience "Thermal Bounce"—where voltage drops at night due to the cold and bounces back up in the afternoon sun. Version 1.5 introduces a new way to calculate battery degradation to help smooth this out.
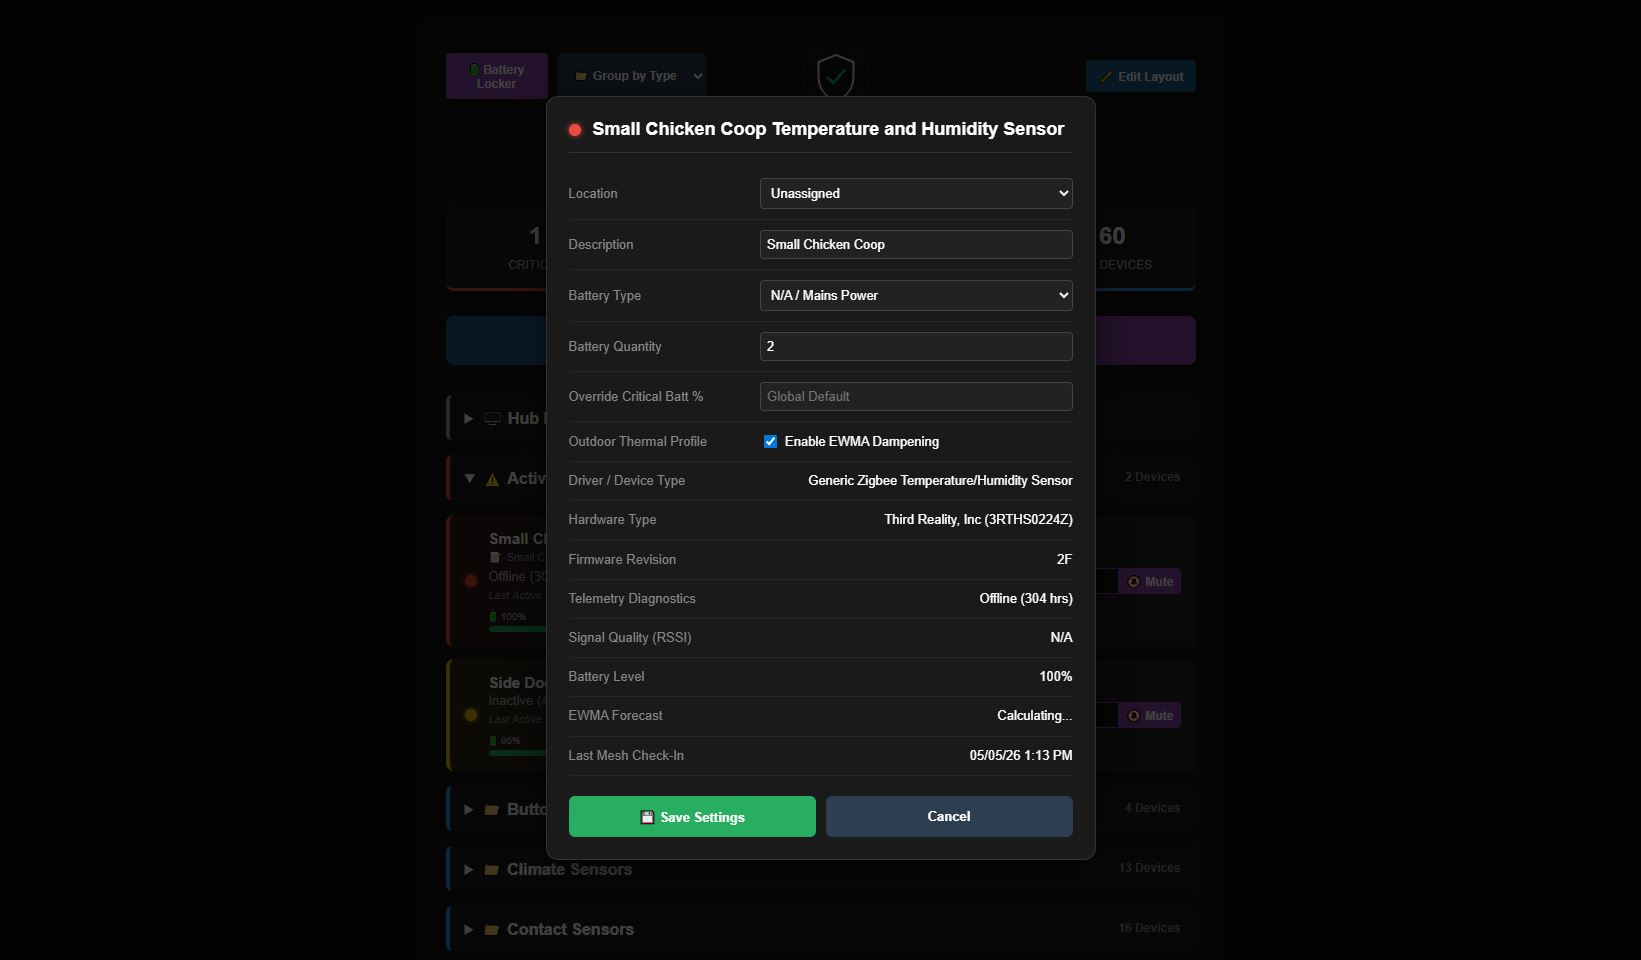
To help keep track of battery inventory across larger homes, we've integrated a dedicated management modal.
When a hardwired repeater (like a smart plug) goes offline, surrounding sleepy battery devices can quickly drain their batteries trying to route through it.
Sometimes standard software pings aren't enough to wake up a stubborn switch.
The dashboard has been updated to function as a two-way configuration tool.
A huge thank you to everyone who has tested earlier versions, shared logs, and provided feedback to help shape this. The updated code is available now on GitHub.
Give it a spin, try out the new SPA portal, and let me know how it runs for you. Bug reports and suggestions are always welcome!
Thanks for another great app. A couple of things I've run into.
When selecting devices the Select All & Unselect All buttons do not work for me.
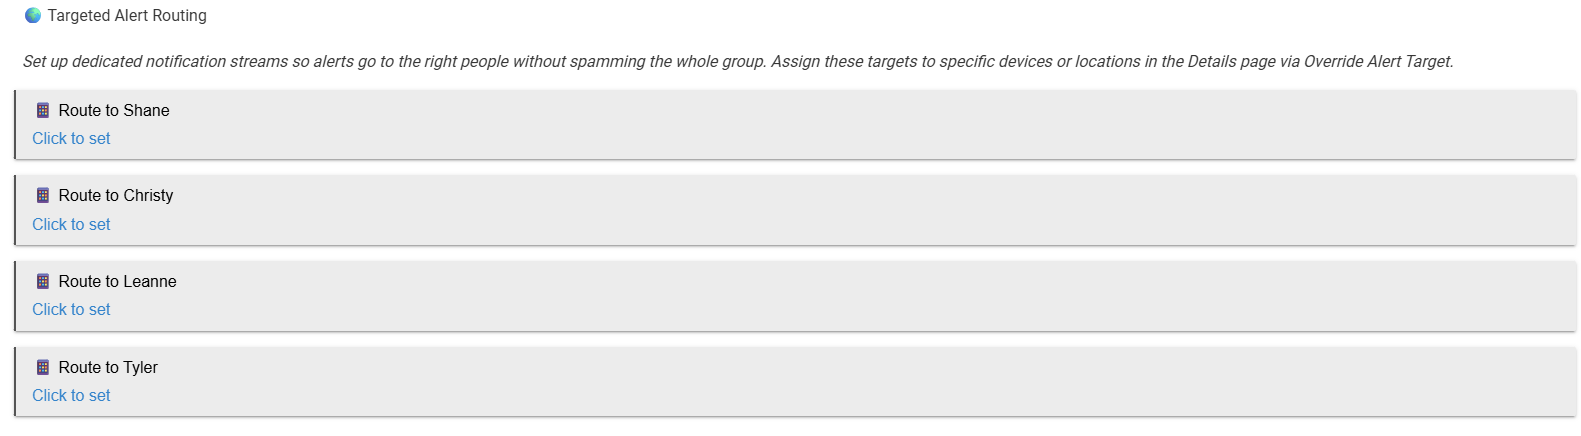
Going into Notification Rules & Routing I found this already there:
Thanks for your time.
That pretty funny, I left my notification devices hard coded. I'll get this corrected and look into the Select All.
Thanks for the feedback.
Fix 1.5.4 is available.
Thanks for the insanely quick response.
Notification devices, all good.
Select All/Unselect All still not working for me. I do not have "an apostrophe ('), ampersand (&), or quote (")" in any of the names.
I just realized that lights I added were turned on by the app. Not all, just about 6 or so.
Sorry, forgot to included headings
You will have to add them to the list of devices to ignore power on/off commands. I added a feature that if a refresh command doesn't bring the device back to life it will try to turn the device on then off, or off then on to bring it back to life.
-This will only happen every once every 24 hours if it things the device is offline.
-I'll continue to look into the select all.
I updated both the driver and app and since doing so I'm getting an error.
I uninstalled and re-installed the app/device and now nothing is showing in the dashboard.
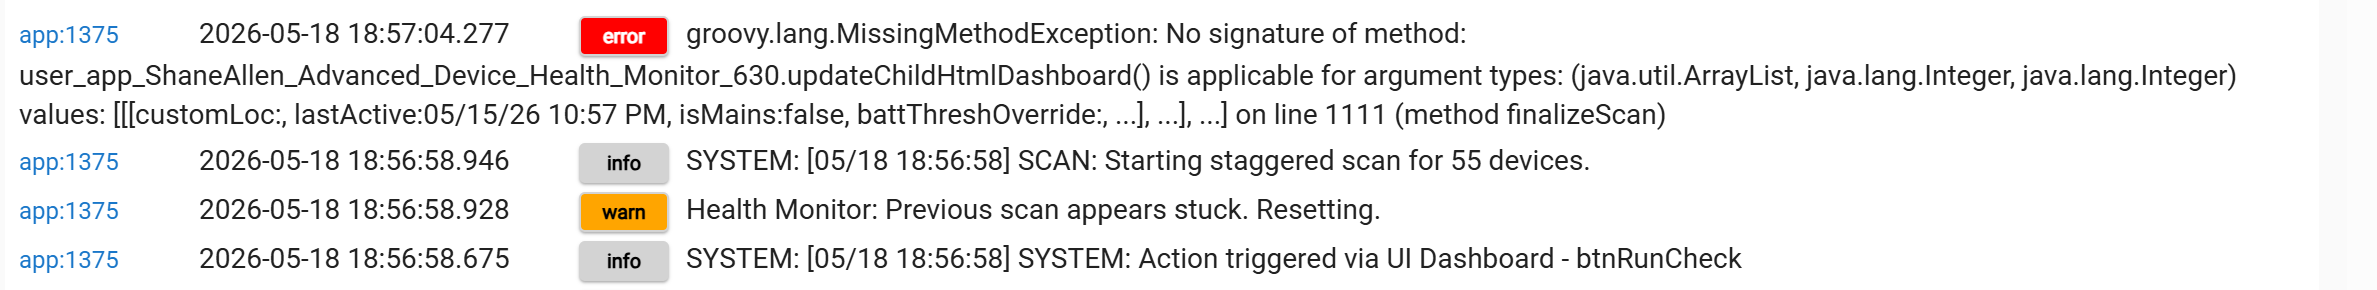
Here is the error.
app:13752026-05-18 18:47:24.784 error > groovy.lang.MissingMethodException: No signature of method: user_app_ShaneAllen_Advanced_Device_Health_Monitor_630.updateChildHtmlDashboard() is applicable for argument types: (java.util.ArrayList, java.lang.Integer, java.lang.Integer) values: [[[customLoc:, lastActive:05/18/26 5:07 PM, isMains:false, battThreshOverride:, ...], ...], ...] on line 1111 (method finalizeScan)
Force a sync. I'll look into this drive code.
Looking into this now.
Nailed it.
Oops. I see you've deleted your post.
It is working OK now though. ![]()
Additional issues are being resolved in the next update patch.
Version 1.5.8 is available
-Bug fixes
-Select All, and Unselect All are unfortunately not working for the foreseeable future until a work around can be applied.
Version 1.5.10 is available
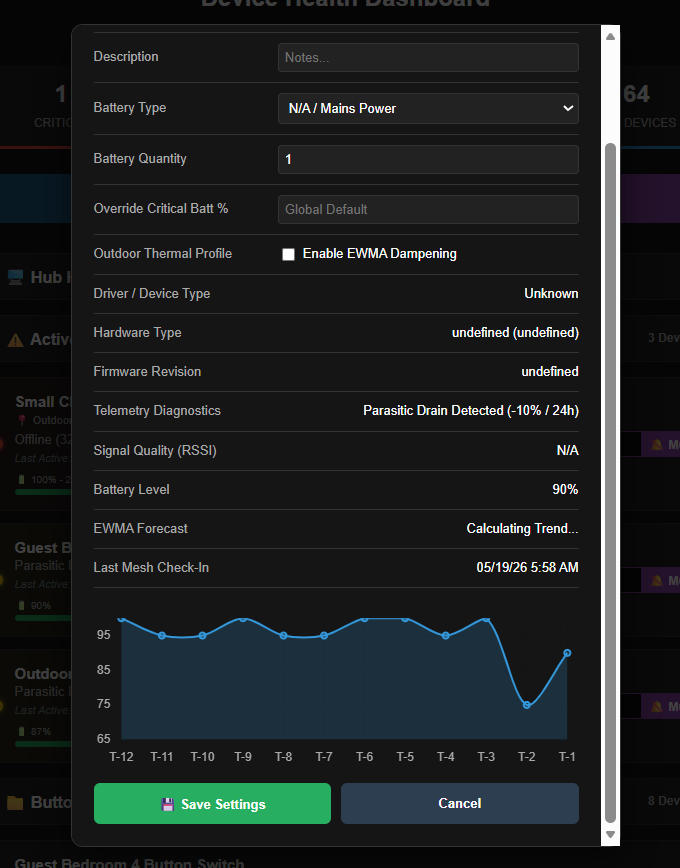
-If a device is in critical or warning the application will pull the battery trend data to create a graph so you can see a live picture of what's going on with the battery life.
-The next update will re-introduce the device type, hardware type, firmware, and battery selection on devices that are in critical or warning. All other devices won't show that information until an alert is present. This is to increase the loading speed on the cloud link as we are restricted to how much information can be pulled before a timeout prevents the page from loading.
Odd characters appear when clicking on the Force Health Scan button of the Portal:
🔄 Stanndard BMS Syncing...
This is in the Firefox browser.
This is currently in all browsers. I've got to update the code to fix this, been lazy trying to hammer the other bugs I've discovered.
FIX per ChatGPT:
return "<!DOCTYPE html><html><head><meta charset='UTF-8'><meta name='viewport' content='width=device-width, initial-scale=1'><script>setTimeout(function(){window.location.href='dashboard?access_token=${state.accessToken}';}, ${delayMs});</script></head><body style='background:#0d0d0d;color:#fff;text-align:center;padding-top:100px;font-family:sans-serif;'><h3>🔄 Standard BMS Syncing...</h3><p style='color:#666;'>${msgText}</p></body></html>"
ChatGPT explanation:
The browser is interpreting the UTF-8 emoji bytes as a non-UTF-8 character set.

Use both fixes:

Add an explicit UTF-8 charset meta tag.
Replace the raw emoji with an HTML numeric entity.
Version 2.0 Available
adv-stat-row (Model, Firmware, Driver) in the modal.isHealthy calculation in both the Backend (serveDataEndpoint) and the Frontend (openDeviceModal). The system now explicitly checks for the "FW Mismatch" string, ensuring that diagnostic details remain visible for those devices even if their status is "Blue."paragraph and section block containing the duplicate header in mainPage() and consolidated the versioning into the main dynamicPage title for a cleaner, professional look.max-height and overflow-y constraints from the batteryLockerModalBody container. This allows the modal to expand naturally and rely on the main modal's viewport-height-aware scrolling, making the data much easier to scan.Download the Hubitat app