What should I be checking? I haven't seen any errors in logs. Refresh tokens maybe? This being seen on our wall mounted tablet running Fully Kiosk Browser.
That typically means that your dashboard isn't "up-to-date" with the current state of all the available devices. Clicking on it will force an update and you'll get your green check mark back. Someone else may have to pitch in if you want to get to the root cause of the issue.
1 Like
Are you using the Local or Cloud dashboard link? I've found the Cloud dashboard rarely refreshes after a few minutes whether I am using it on my network or remote. On my network the Local dashboard never fails to stay up to date.
I could have sworn I'm using local but I'll have to double check.
It's also possible the device you're checking the dashboard on has lost its connection, and is unable to refresh.
Actually I hadn't thought of that. I suppose it's possible. The touch portion has been acting up lately.
This is true for me as well. I get this when my network or Wifi is not working.
If you are on own network, you should be using the local dashboard, and configure it switch to cloud when you leave your network. That is how i have mine set up. The only time I see the exclamation points is breifly when transitioning to and from my network and switching between local and cloud.
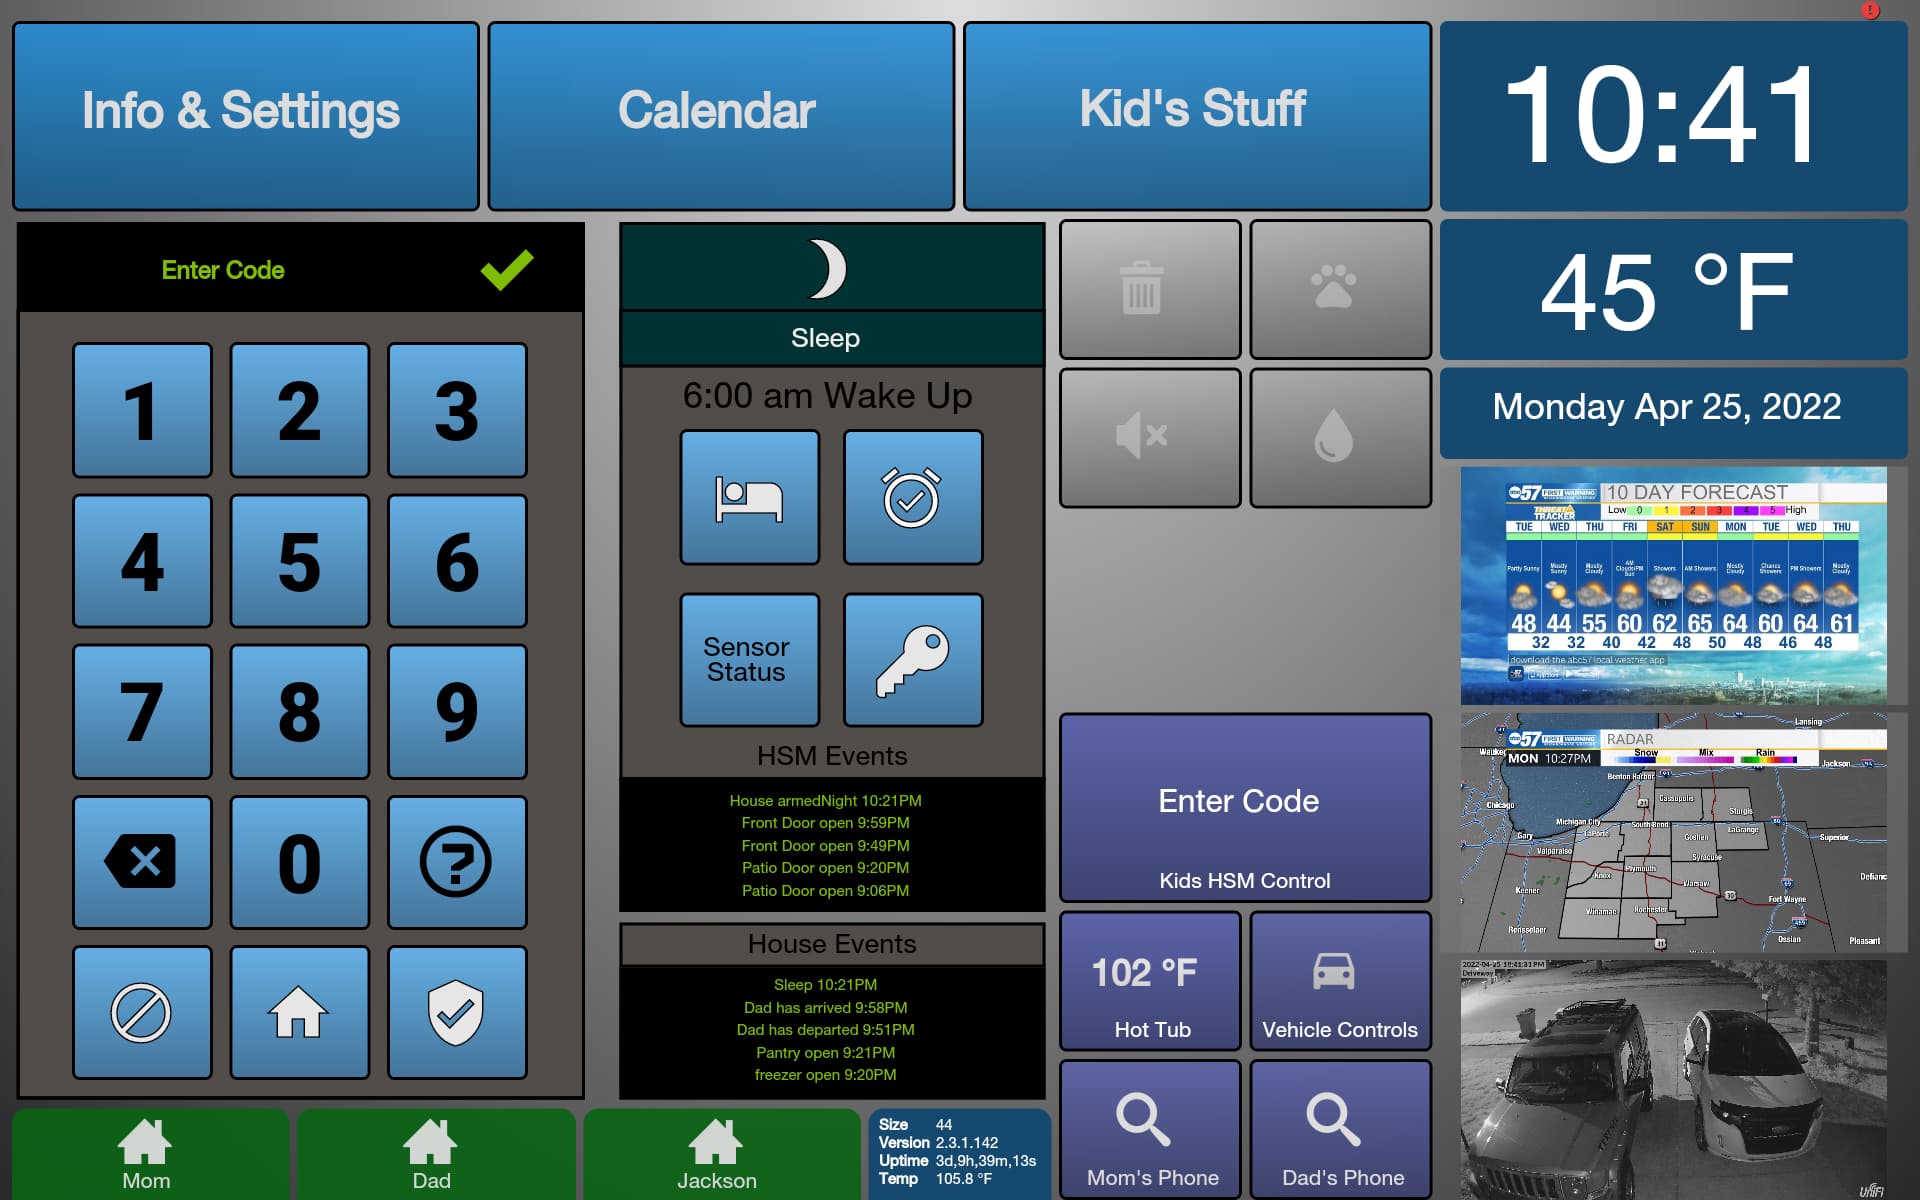
Ugh! It's happening again. I don't get it. I have a wall mounted tablet that this is happening on. Same network, same vlan.
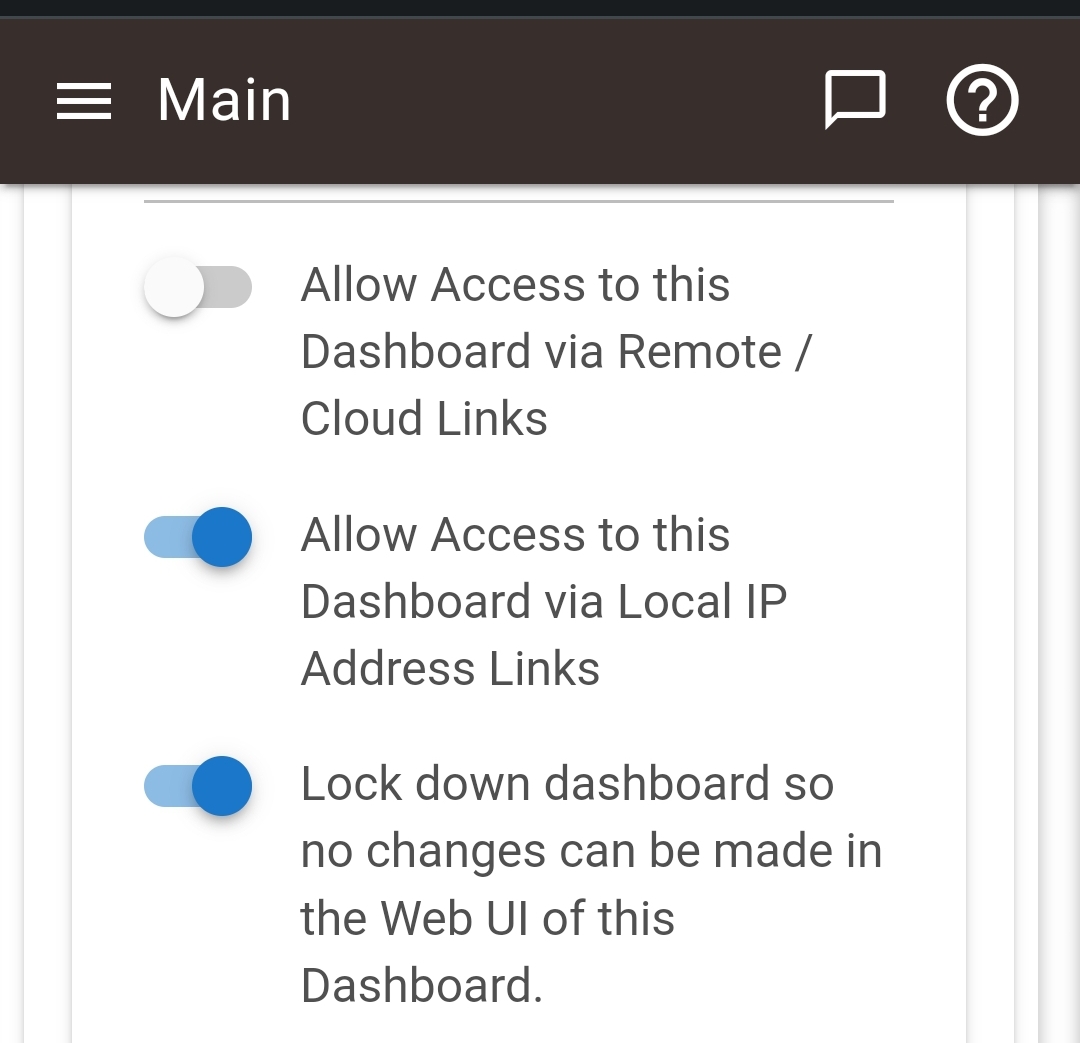
This is the settings I have for it.
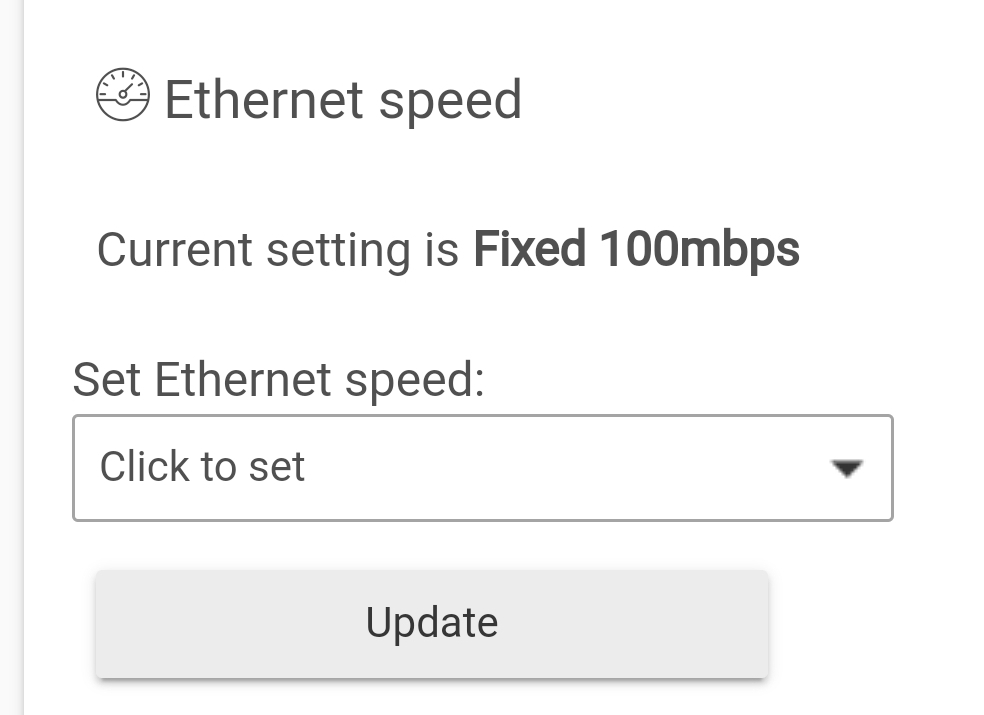
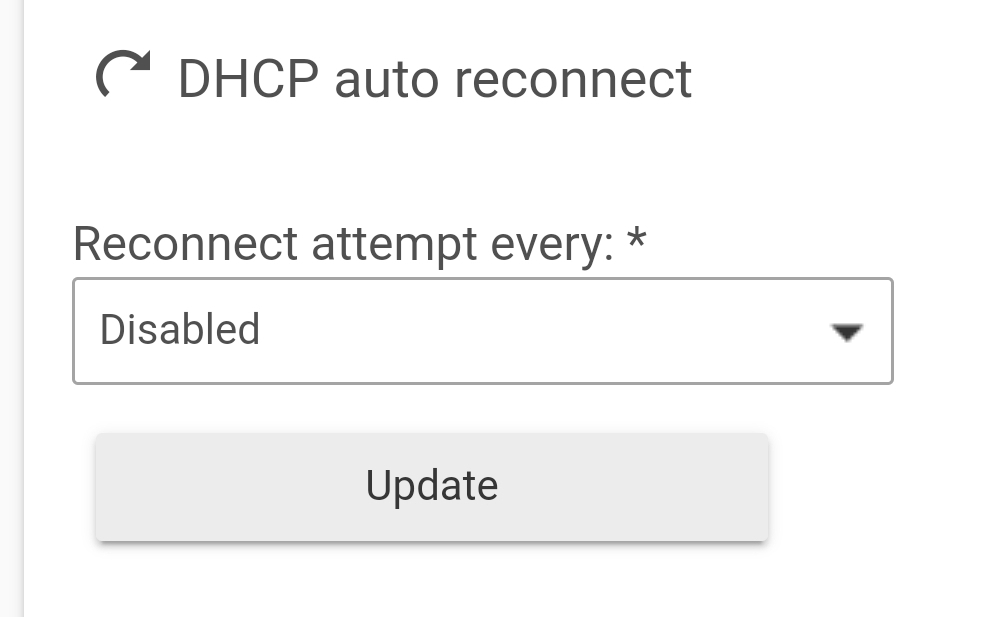
I updated my network settings cause I thought that might be causing an issue. DHCP auto connect at 30s. Static IP set up too.
I have tested with both legacy and standard local lan links and it still happens. I wonder if I should enable access via remote? Doesn't make sense though
I've also checked to see if the tablet I have been using has dropped connection at some point. I don't see any signs of that happening at all.
I've done some further testing with this.
First I reset the access token. Set up the new link on the tablet. It still goes red eventually. Stays that way. However all the attributes on the dashboard stay up to date.
I then also loaded the same dashboard on my laptop, my phone, and manually refresh the tablet. They all eventually went red! In my mind this means I have an actual HE related issue or I have uncovered some kind of bug. @gopher.ny
Noted, will check it out.
1 Like
I just got a brand new tablet yesterday (Samsung Tab A7). This same behavior is happening with it as well.
I'm wondering if is something having to do with my network settings.
I have exactly the same problem. I have an iPad in the house with the dashboard up all the time. Constantly getting red exclamation mark. Sometimes more than once an hour. Sometimes once a day. Really annoying. It's on the local network and the network connectivity is perfectly fine. If per chance there is a momentary network glitch (which I doubt), would it not just go back to a green check mark next refresh? This kind makes the dashboard display useless.
Another date point. The other day I noticed the dashboard was showing incorrect status. Checkmark was green. Refreshed and status was then correct.
And, at another point I saw the red exclamation point. So I did NOT refresh - status looked correct. Opened and closed a few things, dashboard status changed.
So. I have absolutely no idea how to tell when the dashboard is stale or when it is up to date.
This really sucks.
Has anyone had any luck fixing this? I have an iPad mounted on the wall and there is absolutely no way to tell if the status it is showing stale or not. No correlation between the red/green indicator. And after some minutes to an hour it always shows red. I gave the iPad a static IP address and it didn't help. The dashboard is essentially completely untrustworthy.

