This is a fairly simple driver the monitors a Neurio (now PWRView after their purchase by Generac) home energy monitor. This system uses a couple clamps to determine the power usage in your breaker box or subpanel and connects to your WiFi to return the data. The device itself has no control capabilities as it was designed purely for monitoring. Please note, Generac has discontinued support for this product. My device has now died, so I am unable to actively improve the driver on my own going forward...
Feature(s):
Polls data from the Neurio (PWRView) home energy monitor
Populates current and power attributes that are standard for Hubitat
Populates a number of custom attributes for the various sub-metering and other data the monitor can provide
Checks my website daily for an updated version of the driver (if any)
Available within the Hubitat Package Manager (HPM).
Setup:
Using driver link above download the driver as a user driver or import it into the window
Save driver
Add a Virtual Device device
Select the Neurio driver for the Device Type
Enter the IP, Username, and Password in the Preferences section (plus any other settings desired) and Save Preferences
The timestamp is provided by the Neurio so I would be hesitant to manipulate that too much. But I could probably add another attribute "Data As Of" with a more concise one.
As for fonts and stuff. I think you could do that using standard HTML commands as it is formatted HTML. So you could use whatever size or type methods that HTML allows for. Bold, italics, extra lines. All that works. I use bold and extra lines but I have not personally changed the font type or size for my tiles. I can give it a check tonight when I am home if you are still trying.
If we could utilize the Hubitat local time of the event processed, that would be good enough for me to the minute; and need not be the GMT time and precision of whatever the Neurio sends as its timestamp. That ought to be easier.
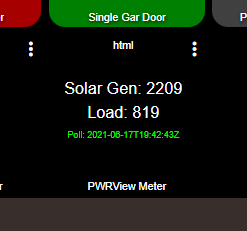
To this I want to add the net excess power to grid value which is equal to the Solar Gen (where it is measured here) and Load (where I have that being measured). Right now, the driver code comes back with power and energy (under the standard tile) as the same value which must be an error. And now, that number is a negative value when there is solar excess into the grid. When there is more load than the solar can cover, that would be a positive number and that is also the case with no solar when its dark, etc.
If I could edit the text of the attribute tile from power or energy to something else, I could use that very simply but I don't know how that could get edited.
Or I combine all the data I wish to display and name it the way needed in the html tile approach, or perhaps 2 of those if one does not have enough space to display it.
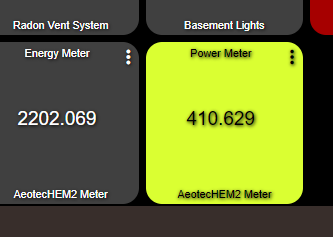
Another thing, on the built in attribute of the "normal" tile, is there way to edit the number format, ie round the units, or truncate them versus what I get from t he Aeotec driver and tile, is like 3 or 4 digits after the decimal which is kinda useless and takes a lot of space. Does this have to get done in the groovy code of the driver or where?
Here is how it looks now. Your are helping me learn how the coding works. Is there a primer for groovy?
Excellent news on the HTML formatting there, looks decent.
I have an update I am going to post right after this that adds in "DataAsOf" which has the month/day/year hours:minutes, although hours are in 24 hour format if that is OK (no need to deal with AM/PM then).
Adding values together is easy to do in groovy but not easy to do (that I know of) in the html tile. There is a lot of variability in how people use those values which is why I never summed them up or such. You could add them in a Rule maybe and then set it as a global variable to use, without having to edit the groovy (and remember to re-edit it if you take any further updates).
Rounding needs to be done in the driver from what I can find, I do not think there is any way to do it with the html tile. It is pretty easy... you go to the value and run the round function. For example, if I have:
That would take the Channel6Voltage (say, 117.800) multiply it by 10 so it is 1178.00, then it rounds it to the whole number so it becomes 1178, then divides it by 10 to get the decimal back in place for a final value of 117.8.
I can change that in the code but I have not gotten all that much feedback on this driver (versus others) so I am not sure what level of rounding would be best. Since I really do not use it that often and when I have thought of how I would it is always within Rules (which do not care how many digits) I have not worried too much about it.
For a groovy primer, I have just Googled what I needed in almost every case and usually I found something related. That said I have generally ended up at the following two places for most answers:
I have a 1st generation Aeotec HEM myself... when it is working it seems to work OK but it is a very chatty device so when it (invariably) drops off for whatever reason I have rarely bothered to put it back on (it was secondary to the Neurio for me anyways).
Addition of "DataAsOf" attribute to show when the data was last updated per Hubitat's time (not the timestamp provided by the Neurio). This is formatted in the "MM/dd/yyyy HH:mm" with the hours being 24hr time to keep it simple.
Is current (A) available anywhere? Or only Power and voltage on each channel?
What is the difference between CONSUMPTION_POWER and Channel Power in each channel? Is there a definition of every "attribute" that is available for us to look at?
Energy is consumed over a period of time, so basically it should be counting up always. How is this calculated, or is it something polled directly from the meter? On mine, it literally matches the "power" metric all of the time. It is technically incorrect.
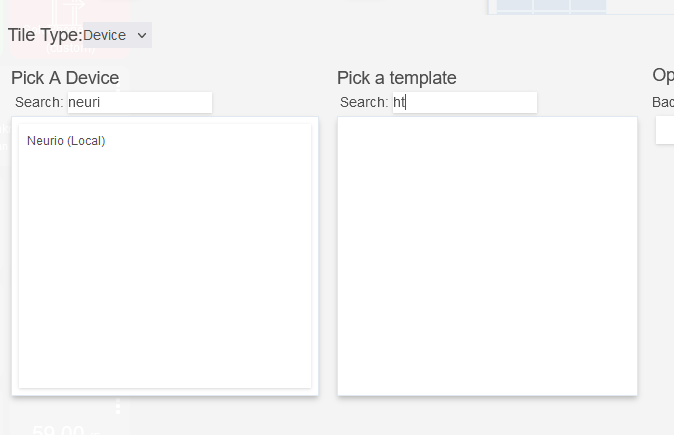
I can't figure out how to get the HTML tile template to show up in the dashboard. Any tips? Additionally, my HTML doesn't allow me to use "</br>" - it deletes it and pretends it isn't there after I save it, as shown in screenshot below.
Thanks!
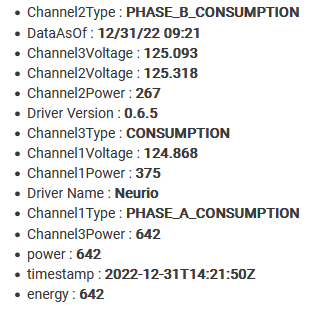
Edit: Adding in a view of my variables just to share.
This driver is pretty old and I do not remember much of the top of my head, but I will try to answer stuff quickly now and then more later when I get home and can review it to refresh my memory (anything I mention as something I will do, it should be this afternoon/evening):
The Neurio did not provide amperage data when I last worked on the driver. I will check mine later to see if the API for it has been updated to include it since.
There is not really a definition because there was not one listed when I made this (the API was very basic). Consumption was combined power usage for the phase and total. So they would be very similar to the channels.
The driver does not calculate much of anything. The various values are as reported by the API.
The HTML Template method will no longer work properly. Hubitat removed the ability to include HTML in preference values (as you see it removed). This driver has not been updated since that change as I really thought there was nobody out there using this anymore (besides me). I have newer code in other drivers that changes this to a Tile Template method (and accepts HTML-like format, ex: [br]. I will make that change (and maybe some others) and get an update published later.
Appreciate the rest, makes sense, I may add a function to calculate amperage (although you'll certainly understand the code-side better than me - i'm a power engineer, but if you have the time to implement this logic too - then you sir deserve a VERY happy new years!!!)
(Phase Current) = (Phase Power) / (Phase Voltage) - for example, this could be implemented per channel, published as another attribute, and call it a day.
i.e. 1000 w / 120 v = 8.33A on that phase.
--
I was going to also do the rounding code adjustments noted above. I think it's very reasonable to trim everything to 1 decimal point (or even ZERO decimal points at this accuracy level makes a lot of sense to me for both power and voltage, at least... current is nice to see at least one). Anyway that could also be in the main driver for others if anyone grabs it. No biggy, but my 2 cents too.
My LAST question is about polling rates. Is there any reason we can't go faster than 1 min? Would 1 second break things? I send all of of my hubitat data into a database, and basically want to recreate my own custom power views in grafana later - becuase the pwrview app is miserable.
Rework of the data response handling... This was very out-of-date for how I have learned to do things and could not handle too many additional items.
Now includes an amperage value based on the total of the CTS that are reported. The driver now supports the CurrentMeter capability to handle this. The data DOES NOT say which channel is associated with which CTS data... so I cannot link the amperage reported directly per channel based purely on a direct reporting of the data.
EnergyMeter capability has been REMOVED. As the data response does not include any tracking of power over time and I do not perform that calculation in the driver, the usage was incorrect (as @user3666 pointed out).
PhaseA & B, as well as Consumption data are now included again. They WILL duplicate one of the channels (likely 1, 2, and 3 respectively) as that is how they come back. But the code now has the flexibility if they are elsewhere.
There is no longer a limit on channels returned. Before I only checked up to 6 channels but now it will run through as many as the Neurio reports. Although their API indicates a max of 6.
HTML Template method has been replaced by the Tile Template method I use in my newer drivers.
Major overhaul of background code such as update checking, driver versioning, etc... to make it more in line with how I am currently coding my drivers.
Note(s):
Thanks to @user3666 for prompting me to even look at this driver after so long. Also, with regards to the more recent questions:
Yes, I could calculate amperage per phase or channel (as you indicated). I thought about doing that but already had so many changes I wanted to call it quits with this update.
Rounding... since there IS a desire for it, I may implement it in the next version. Maybe I will make it configurable in preferences...
I do not know of a SPECIFIC reason why the query could not be made faster. In my experience with other local methods... some devices start to get a little "bogged down" and the responses can get a bit mixed up if the polling is too frequent. There is nothing preventing the possibility from being done code-wise. I have never tried seconds-based refresh for Neurio. If I was using their cloud API there IS a hard limit of 120 polls an hour, but I am not relying on that for this driver.
The link you have there has the latest. Sometimes, especially if someone has recently checked the code, a browser will cache it. Trying to be helpful... but it really is not in this case. I do not put versions as part of my file names so that people can always just Import the latest code (although that can ALSO suffer the browser cache problem).
You can do a force-refresh of the .groovy page in order to make sure it is the latest 0.7.0.
Three driver-specific attributes "Driver Name", "Driver Status", and "Driver Version" have been replaced with ones that do not have spaces in their names. These will be removed the next time Save Preferences is selected.
Thanks for the driver. I just resurrected my original Neurio and put it in my ADU panel. There's no solar, but it's on the same meter as the house, so it's good to get some idea of its power use.
I did notice:
roovy.lang.GroovyRuntimeException: Ambiguous method overloading for method java.lang.Integer#plus.
I've traced it to line 233 amperage calc. Amps is not in my (at least) json return, so I modified it to use W/V instead.
  def TempAmps = 0
    Json.cts.each{
        TempAmps = ( TempAmps + it.p_W / it.v_V ) //dlh i_A not in cts
    }
Could you send me a sample of your json via a private message? Set your device to "Trace" logging in the preferences, then perform a manual refresh. The json portion is the line in the log starting with "Raw Response".
I ask because mine DOES include the Amps... so I want to see if there is some other difference(s) that need to be accounted for.
For now, I have made a change that if the Amps are provided "it.i_A != null" then it will use that, otherwise it will calculate it like how you are using. Posting the new version momentarily.
Handling for if the amperage is not provided as part of the data, it will be calculated per @user1203's post. If it is provided, it will continue as it always has.
Changes to how Tile method is performed to match up to newer methods and how Hubitat now works.
Changes to how events and states are processed to match up to my latest methods.
As my Neurio is no longer working AND Generac has discontinued them... I am no longer able to directly support this driver... If someone finds a problem, let me know and I can try to deal with it but I am not going to be able to engage in any active changes/improvements on my own going forward.