I started a thread along similar lines a while ago now and people have posted a range of options that you may want to consider. I've also posted some detailed notes and links to other threads I used in setting up my temperature / power monitoring.
I went down the InfluxDB + Grafana route like @potts.mike mentioned, but Hubigraphs would certainly be a much simpler solution if it can cater for the power readings. The InfluxDB / Grafana setup requires an external "server" of some kind, typically people use a raspberry pi, but almost any "always on" machine would do, including Windows I believe. My setup isn't the smoothest one to get going, but you will have support here on the Community if you get stuck.
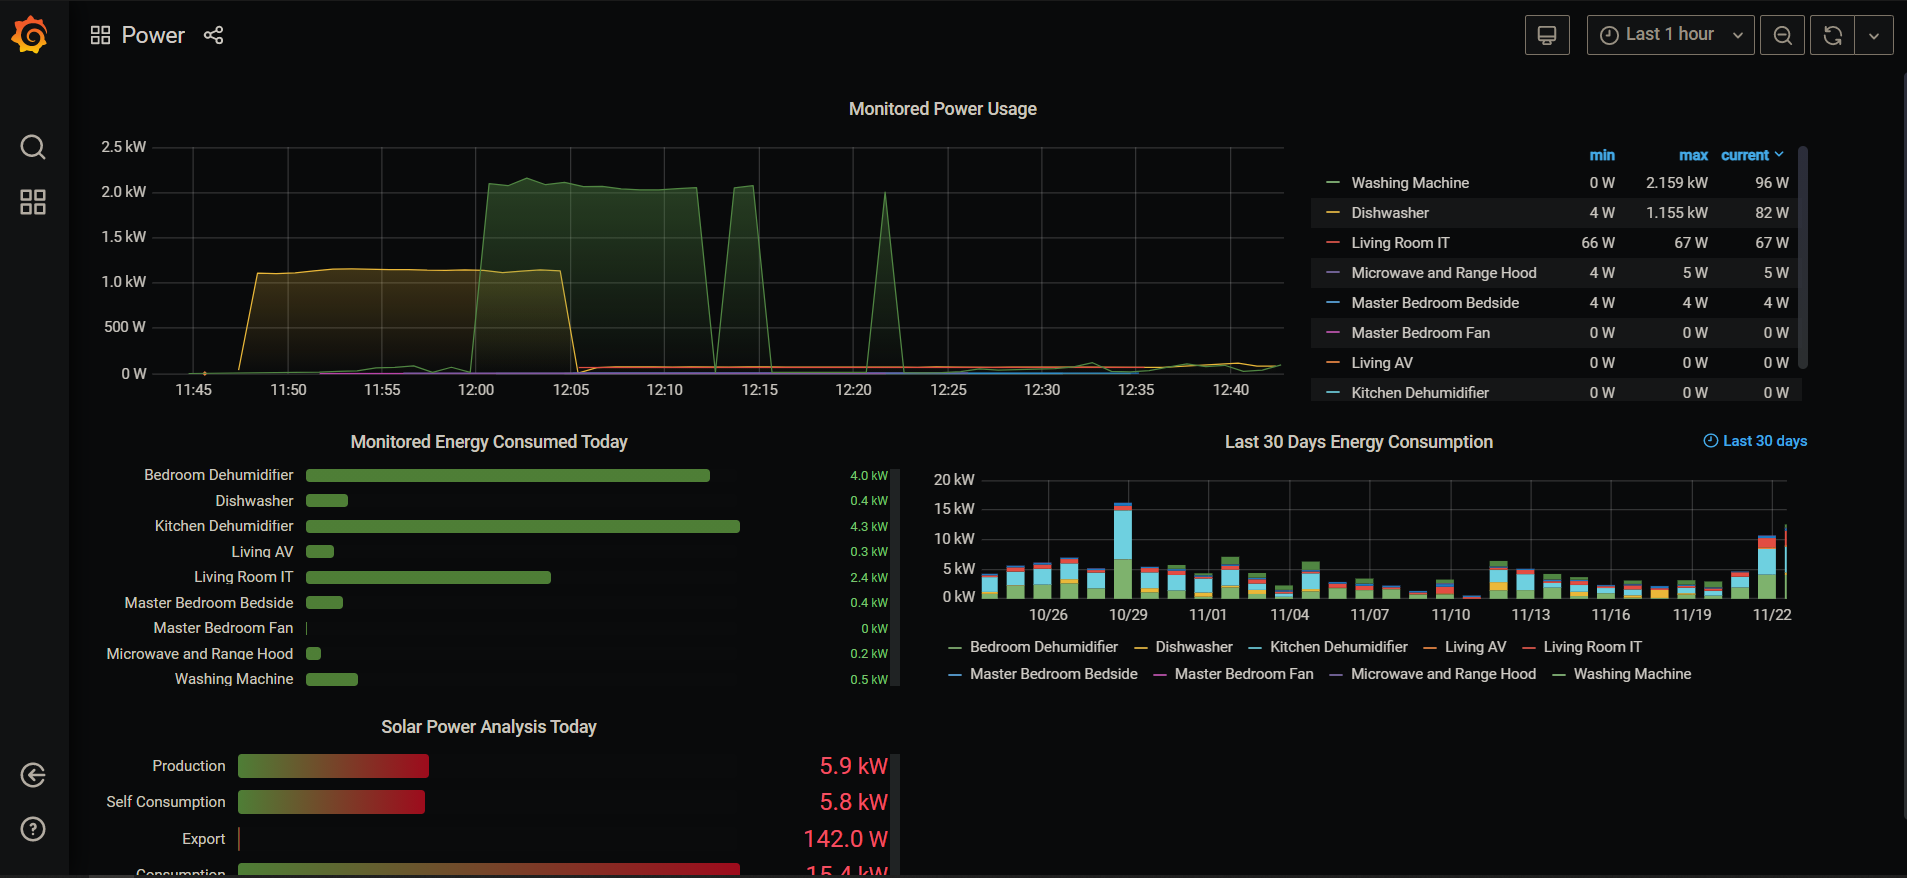
I've posted a screenshot of one of my dashboards to give you a taste of the kind of dashboards you can produce in Grafana. I'm certainly no UX/UI expert, so no judgement please.. ![]() ... on me or Grafana!
... on me or Grafana!
In terms of other things you can do on the HE hub, you may be interested to look at are some of the apps by @Cobra that can aggregate readings from different devices to provide averages, etc. You will need to sign up to his web site if you want to download and install them.
Simon