I have 40 Inovelli Red Switches which appear to send out power usage. Is there a power monitor app which I can hook these up to to see fancy graphs and monitor my consumption?
Thanks!
I have 40 Inovelli Red Switches which appear to send out power usage. Is there a power monitor app which I can hook these up to to see fancy graphs and monitor my consumption?
Thanks!
Hubigraph might be able to do it.
Otherwise influxdb and grafana.
Hmmm... perhaps I overreached. Let's start with any amount of collection of this stuff. I can see from the logs that the switches are sending power. I can also see from the device page that power consumption is available. I just don't know the next step...
What kind of coder are you? It would be pretty straightforward to create an aggregator app/device that collected data from your device over a time period and stored the total as an “event”.
I describe my coding as "glue". That is to say that I probably could do it (because you're making is sound like glue), but that usually means that someone good wants and has done it right.
I guess that I'm having a hard time believing that there isn't a solution already around...
Understood; I actually wrote HubiGraph because I wanted graphs on the dashboard. I also wrote a contact sensor aggregator for since I have about 20 Windows with sensors on them (I wanted to know if ANY Windows were open without needing 20 status tiles).
What is the end state that you are looking for? A graph with the sum of all the data? Just a single device that has a sum of all your switches?
Honestly... I was just going to start by wiring it up my switches to the solution that people were using and I was going to go from there... Typing that out kinda makes in sound silly, but sometimes (for me) playing around with the solutions in place spark an "OHHHHH.... I would love to have this data" moment.
I started a thread along similar lines a while ago now and people have posted a range of options that you may want to consider. I've also posted some detailed notes and links to other threads I used in setting up my temperature / power monitoring.
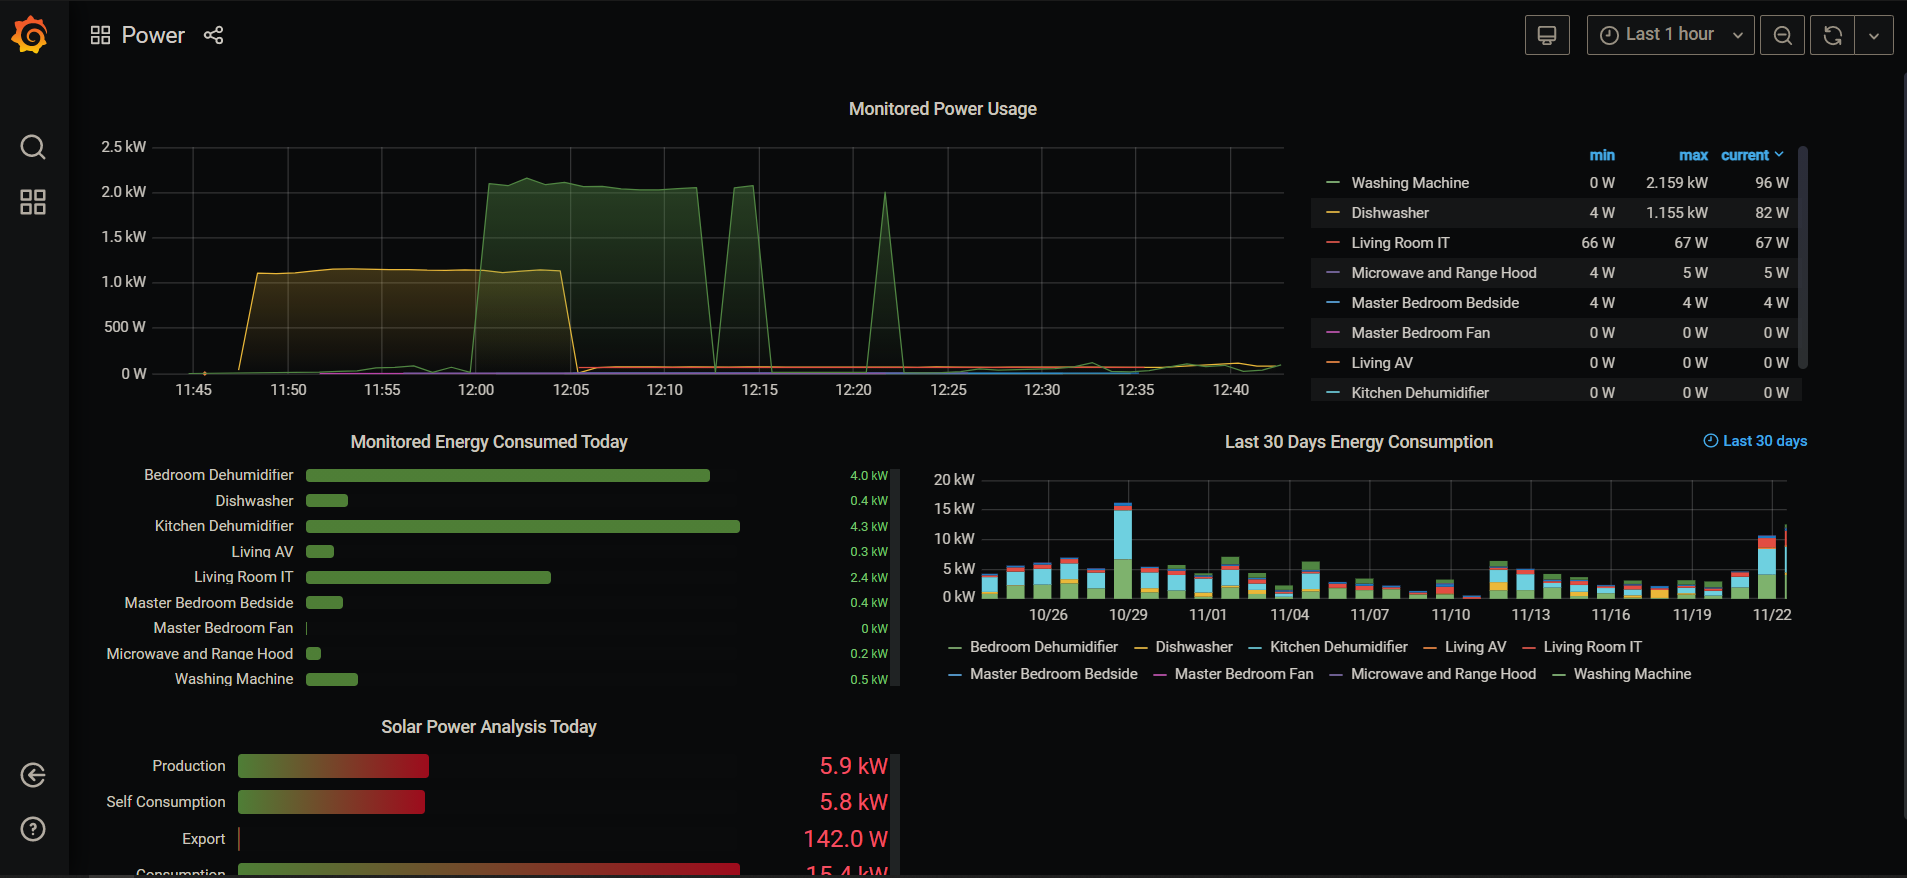
I went down the InfluxDB + Grafana route like @potts.mike mentioned, but Hubigraphs would certainly be a much simpler solution if it can cater for the power readings. The InfluxDB / Grafana setup requires an external "server" of some kind, typically people use a raspberry pi, but almost any "always on" machine would do, including Windows I believe. My setup isn't the smoothest one to get going, but you will have support here on the Community if you get stuck.
I've posted a screenshot of one of my dashboards to give you a taste of the kind of dashboards you can produce in Grafana. I'm certainly no UX/UI expert, so no judgement please.. ![]() ... on me or Grafana!
... on me or Grafana!
In terms of other things you can do on the HE hub, you may be interested to look at are some of the apps by @Cobra that can aggregate readings from different devices to provide averages, etc. You will need to sign up to his web site if you want to download and install them.
Simon