How would I average these three flows? (I did search, but nothing easy).
office_temp_1
office_temp_2
office_temp_3
How would I average these three flows? (I did search, but nothing easy).
office_temp_1
office_temp_2
office_temp_3
Function node, blockly node, or one of the available user contributed arithmetic nodes, like node-red-contrib-aggregator (node) - Node-RED or node-red-contrib-average (node) - Node-RED.
Note, though, if you use a math-like node, many of them require you to make sure the msg.payload is actually a number (not a string). If so, you will need change nodes to convert data type to number.
I most often do this in a function node. I shove each value info a context variable and then in the function block verify I have all required values, calculate average, shove out the result.
Something like:
var newmsg = {};

var temp1 = flow.get("temp1", "fs");
//node.warn("temp1 is " + temp1);

var temp2 = flow.get("temp2", "fs");
//node.warn("temp2 is " + temp2);

var temp3 = flow.get("temp3", "fs");
//node.warn("temp3 is " + temp3);

if (!temp1 || !temp2 || !temp3) {
    node.warn("Bad temperatures, bailing out!");
    return;
}

var tempAvg = (temp1 + temp2 + temp3) / 3;
//node.warn("tempAvg is " + tempAvg);

newmsg.payload = tempAvg;

return newmsg;
Of course that example assumes variables temp1-3 should never be zero. If zero are allowed you would do the value checking differently (!isNaN(parseFloat(n) && !isNaN(n - 0)).
I (intentionally) break the message chain/flow in that example. If you wanted to keep topic, msg id, etc you could just set msg.payload to the average and return msg instead of newmsg.
Thanks. I got this error in NodeRed, but the calc still works:
"Unknown context store 'fs' specified. Using default store."
That saved me hours. I live in Australia, so the temp is unlikely to be zero in my office, or even outside (celcius).
I have a filesystem context named "fs", if you don't then you would not use that. If you are just using the default variable context, delete , "fs" in each flow.get.
When doing a flow.get or flow.set the last argument is what variable context to store the variable in. Most examples won't even specify that, as most users just use the default variable context. For this example, I wanted the values to survive reboots so used a variable context I specified in the settings file that writes the variables to the filesystem (instead of just being in memory, and thus lost on reboot).
I hope I am the only one silly enough have made this error, but I wanted to pass it along as a warning to others. I have created 2 instances of node red (dev/prod) so that I can leave things running without having to be careful about deployments breaking something. To do this I am using Docker and so each instance needs a different port number as they are sharing an IP address with the Docker host. As I was trying to get everything worked out I went through many parallel instances. Just recently went to use the main hub to dev instance and started to see the following symptoms: I can send commands from NR without any problem and despite setting up the webhook in the maker app, I was not getting any feedback in the device nodes.
Turns out, in all of my changes, I missed correcting the port number in the Make app configuration. That little fix solved my problem. So if you run into these symptoms before you do other massive troubleshooting or report an error like I almost did, triple check the URL in the "URL to send device events to by POST" section.
I am using the trick (@aaiyar mentioned a few thousand posts ago) to store flow.set variables on the disk, not to memory, by editing a file under /.node-red/ (cant remember which now).
I'm getting this error on a temp sensor.
"Unable to cast to dataType. Open an issue to report back the following output: DATE: Apr 7, 2020 8:41:17 AM"
The node in question:
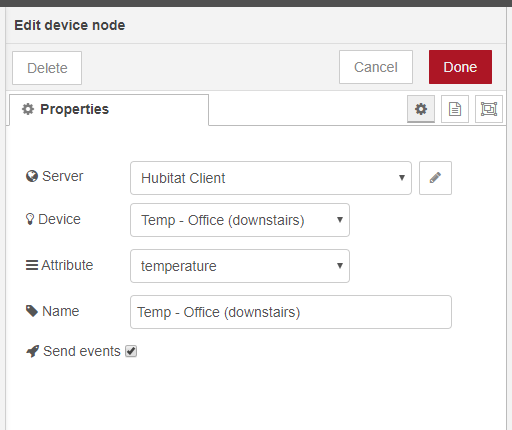
and here are the HE logs
Xiaomi Temperature & Humidity sensor?
Nice, I will PM you tomorrow to ask you some information I need to know to correctly support this dataType. But my guess it is that already correct. For now you can ignore it
Yes.
Yes, it seems to be working.
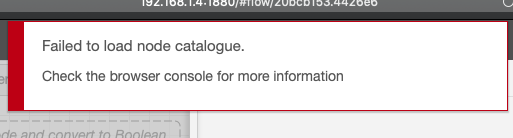
I got this error a few times when I clicked on "manage palette". How do I resolve it?
I've had one other node-red issue this morning. The state of sensors displayed in the browser is not updating - although sequences based on the state of the sensors function as before. This persisted after killing/restarting node-red - and then went back to being "normal" after a while.
Here is a version of that temp average above that takes into account that one or more of the temp sensors isn't reporting. It'll only average what you get a reading for:
[{"id":"c4b753f6.d5042","type":"inject","z":"b1c0e8f3.379a68","name":"","topic":"","payload":"","payloadType":"date","repeat":"","crontab":"","once":false,"onceDelay":0.1,"x":100,"y":240,"wires":[["e83a98c7.909f68"]]},{"id":"e83a98c7.909f68","type":"function","z":"b1c0e8f3.379a68","name":"","func":"\nflow.set('temp1', null);\nflow.set('temp2', 80);\nflow.set('temp3', 90);\n\nlet var_names = ["temp1", "temp2", "temp3"];\nlet temps = [];\n\nwhile(var_names.length) {\n let item = flow.get(var_names.pop());\n if (item) { temps.push(item); }\n}\n\nreturn { payload: temps.reduce((p,c,_,a) => p + c/a.length,0) }\n","outputs":1,"noerr":0,"x":195,"y":240,"wires":[["fa586dad.b1095"]],"l":false},{"id":"fa586dad.b1095","type":"debug","z":"b1c0e8f3.379a68","name":"","active":true,"tosidebar":true,"console":false,"tostatus":false,"complete":"payload","targetType":"msg","x":255,"y":240,"wires":[],"l":false}]
I'm having a weird issue where periodically some of the HE Device nodes "forget" which attribute they have. Probably after a deploy but not sure. The only reason I picked up on it was it happened twice fairly recently to some virtual switches on HE.
Seems to be related to nodes that I am using in a new sequence but not always in the sequence itself. It could be when I'm editing subflows.. not sure.
Doesn't happen all that often but thought I'd report it.
edit: the nice thing is it is really easy to locate thanks to the [x] appearing underneath the device on the flow page..
I have also come across this occasionally.
Don't know, I've never seen that one.
I thinking its a browser error ..... because I just realized I had quit and restarted the browser (Safari) when it went back to "normal".
Try turning off logging on the Maker API app in HE.
I don't have it turned on. And I still run into the issue occasionally.
Okay I turned it off will let you guys know if it helped.
So another weirdness. I disabled logging but then included a generic zigbee motion sensor. I updated the maker api and node-red but the device node was not showing motion. Tried various things, updating, replacing node etc and nothing worked until I re-enabled debug logging. After that it started showing motion events. I then set debug logging off and it was still working...
