I have been watching this thread for Hubigraph and the first thing I thought of was "I bet that could be done in Node Red."
I found a palette node-red-contrib-googlechart and thought I was well on my way. Unfortunately, it installs but there is an error triangle in the Node Palette Manager window and the nodes don't show up.
However, since there is an API, it could be done in Node Red I assume. I am just curious if anyone has tried it. Time to start researching Google Charts' API.
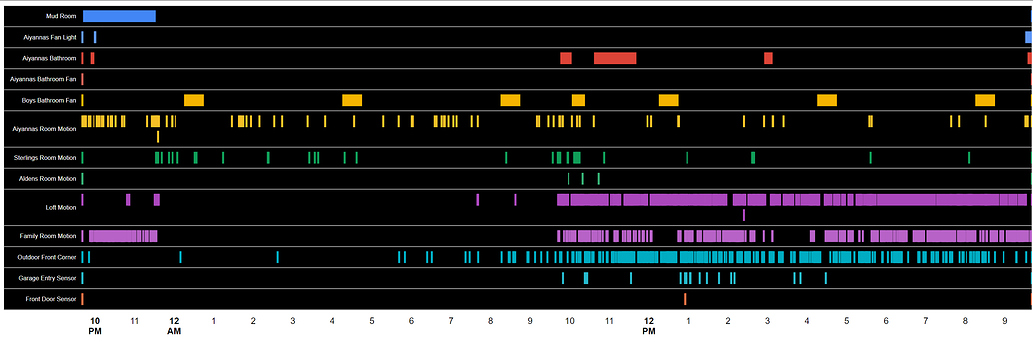
This timeline is the graph I really want that Home Assistant has similar and I really liked: