I managed to get through the first 3 Steps without any issue, but I think I'm struggling a bit around step 4.
in that step @LibraSun Suggested:
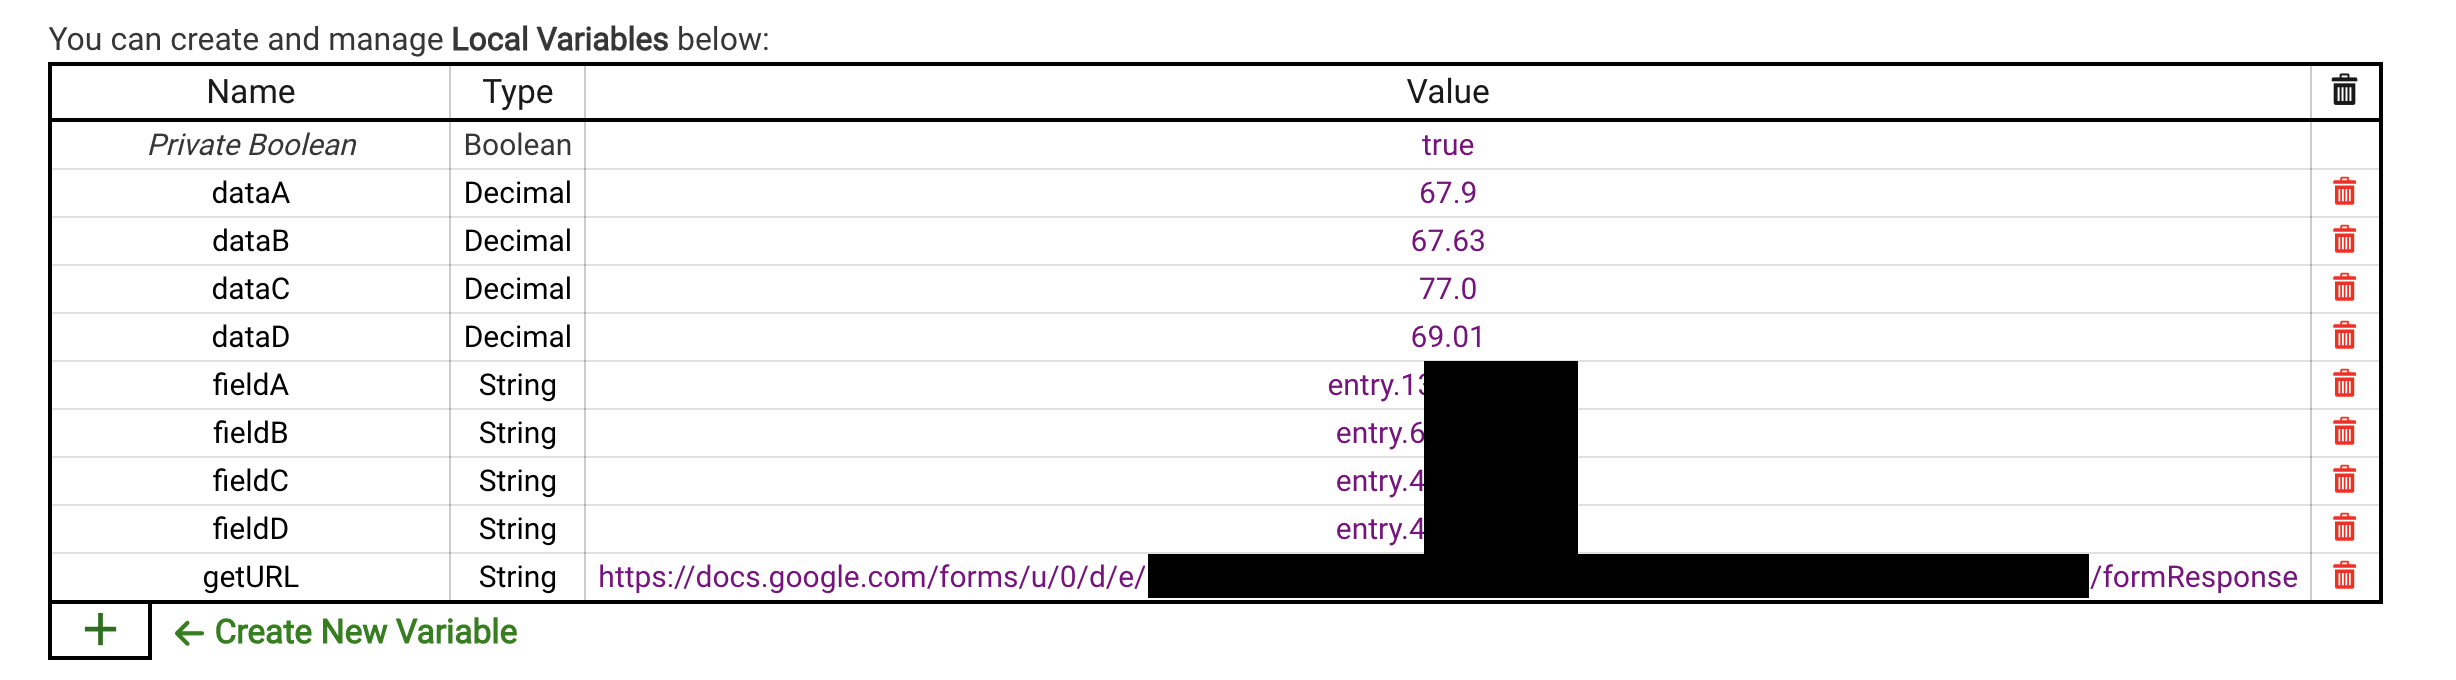
If you intend for the data to come from another source (e.g. device parameter) then your rule must set dataA , dataB , etc. at runtime. And if another rule will be used to set those values, make sure that dataA , dataB , etc. are all Hub Variables, not local ones.
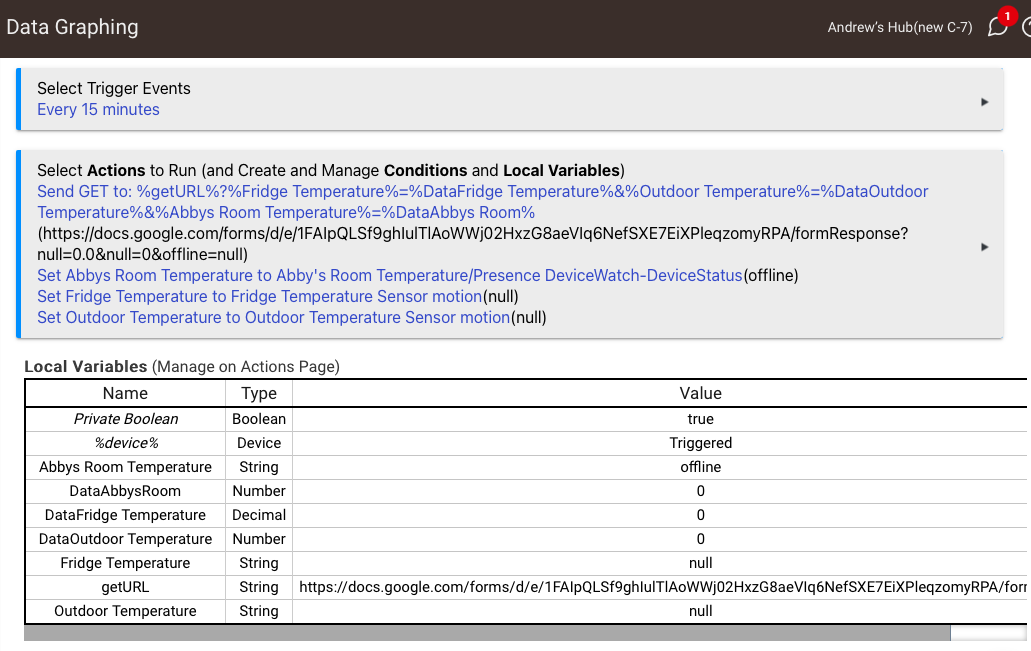
I tried to set the data to come from 3 Temperature sensors, but it doesn't seem to work, and I'm not sure what I'm doing wrong.
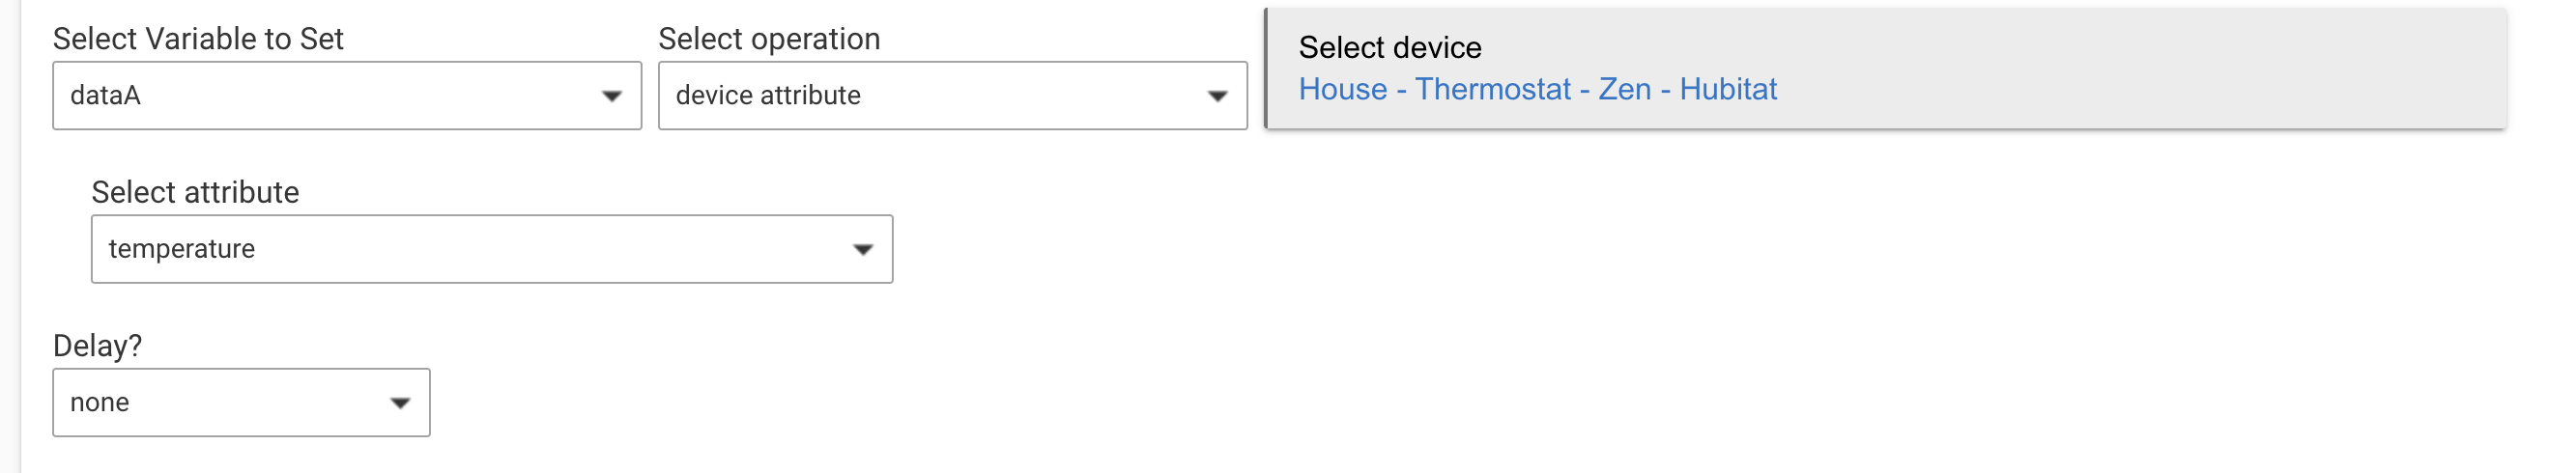
But I'm not doing something correctly.... I select the device, but I can't seem to isolate the Temperature readings (see the above).
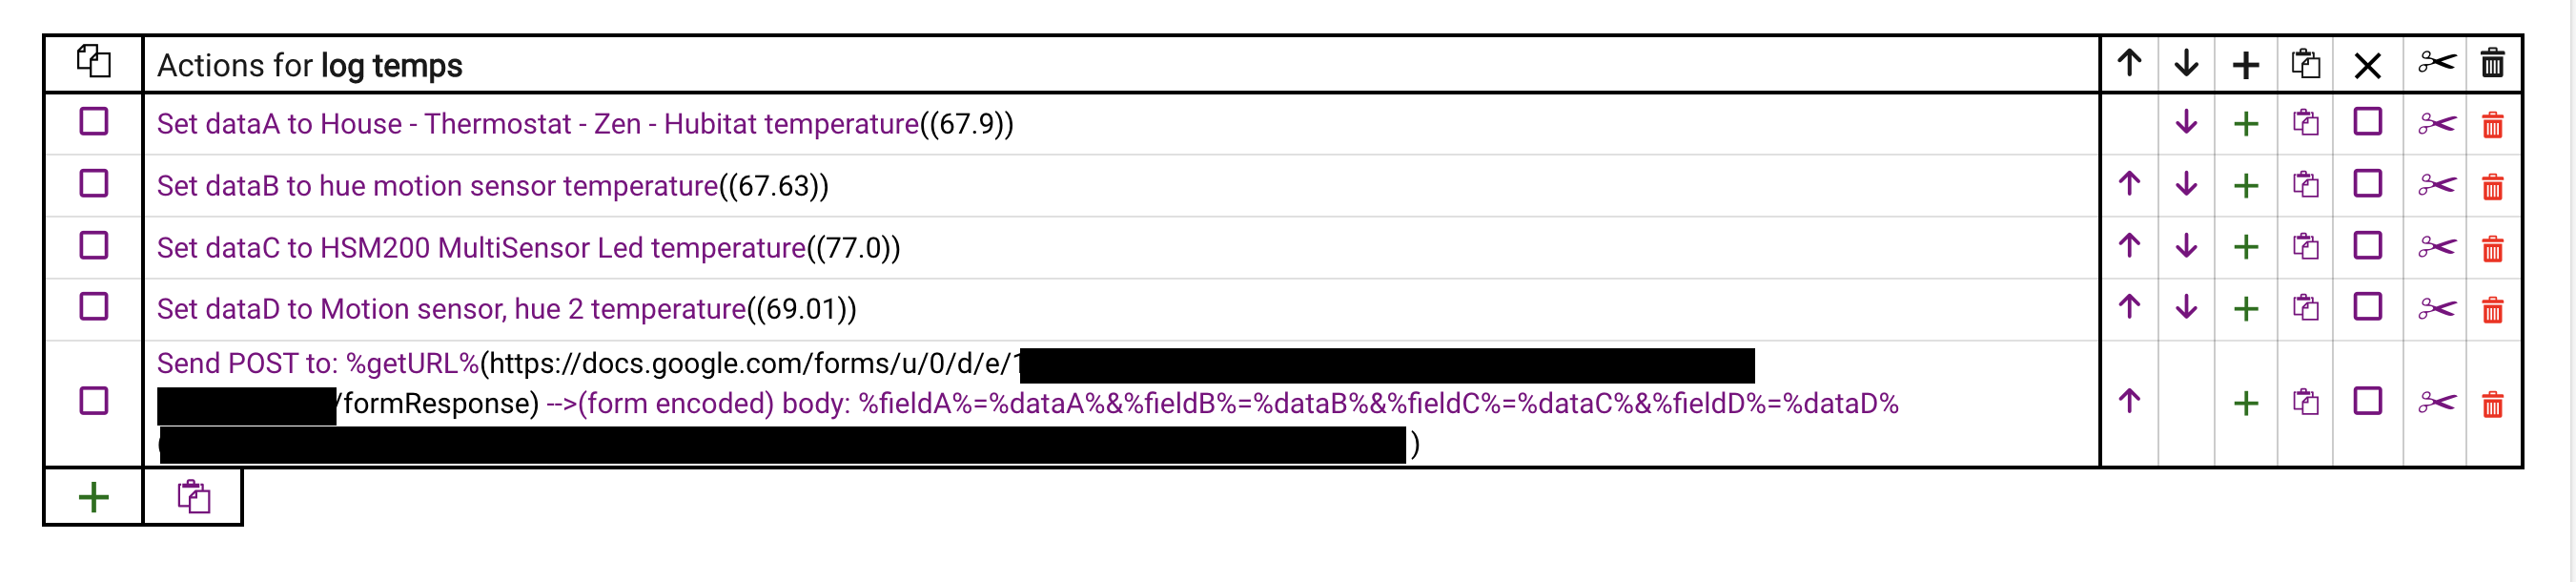
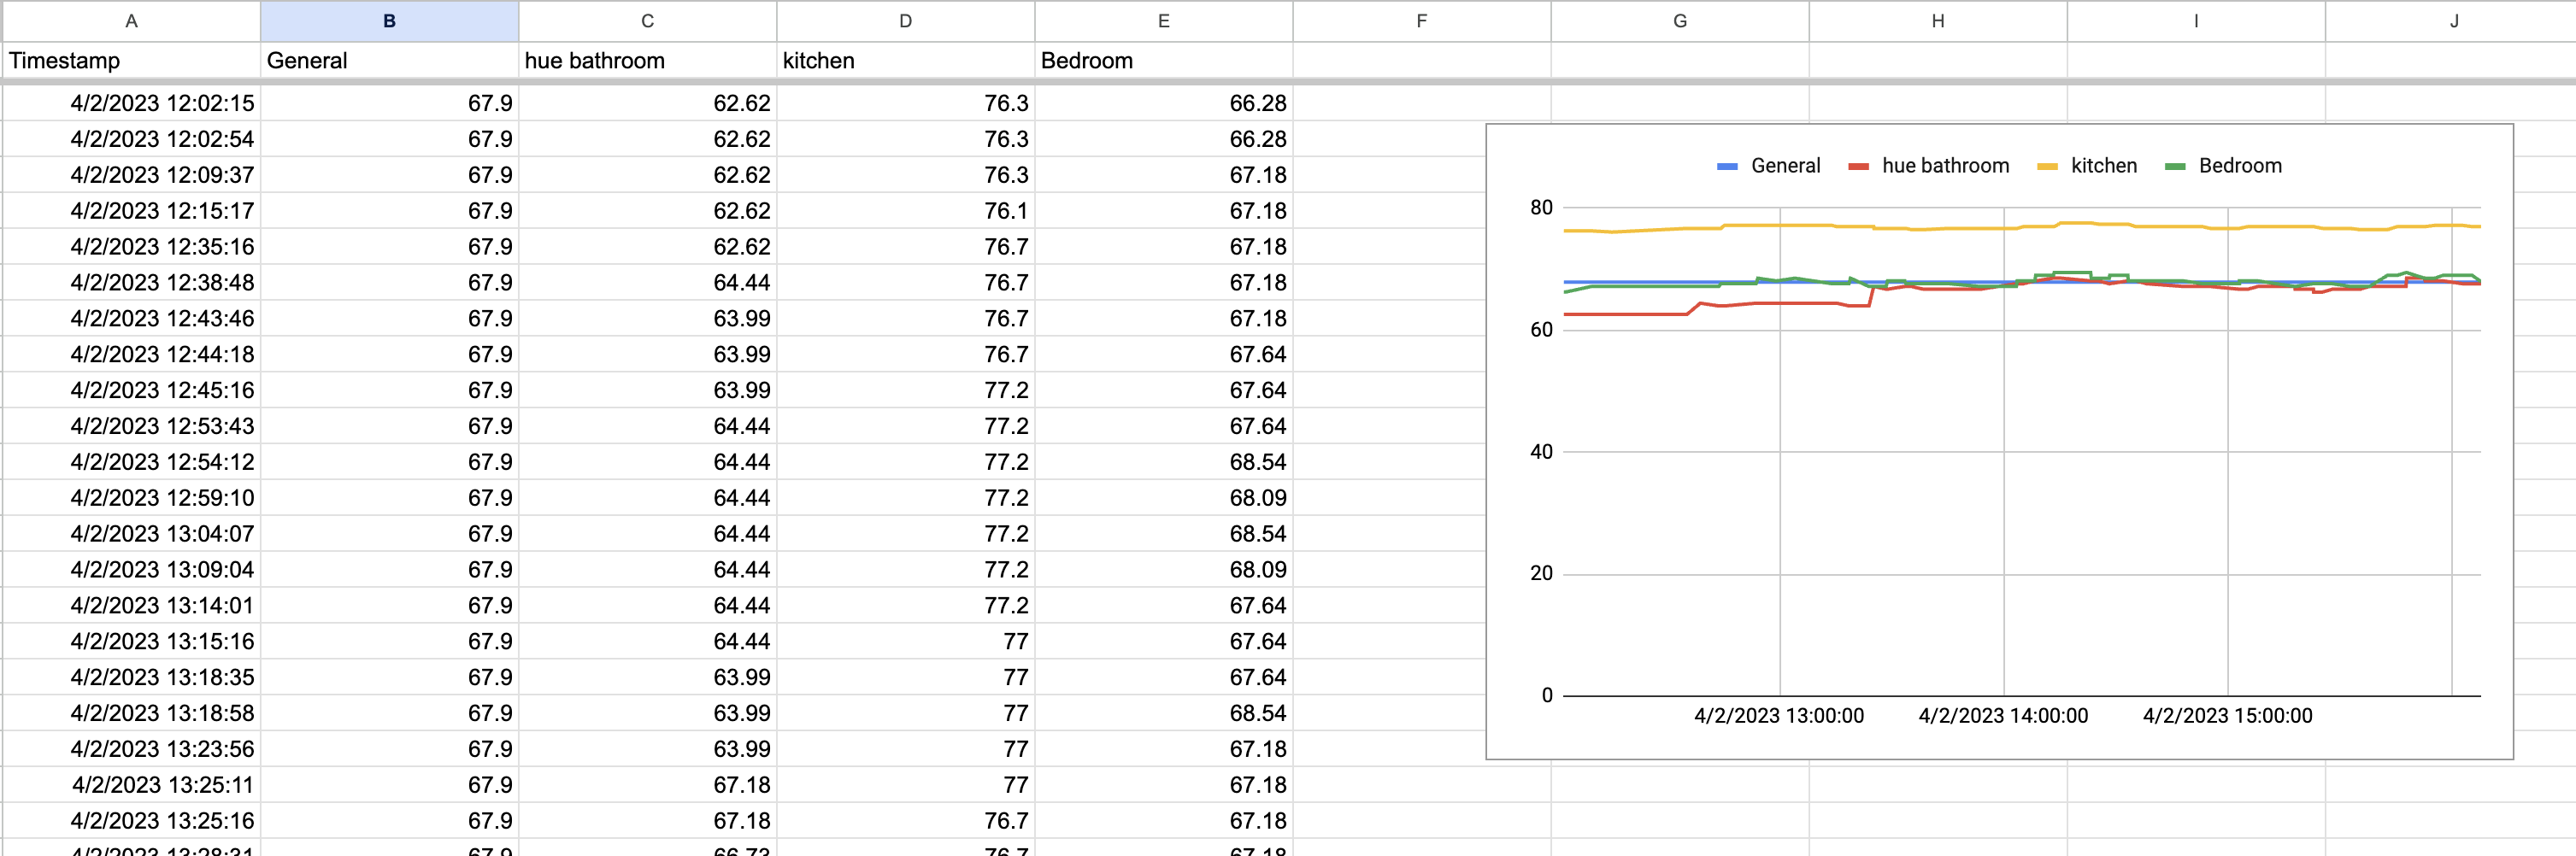
The Google Sheet populated once with bogus Numbers, then hasn't updated since.... (Note that the top row were inputted 'initial values')
what am I doing wrong?
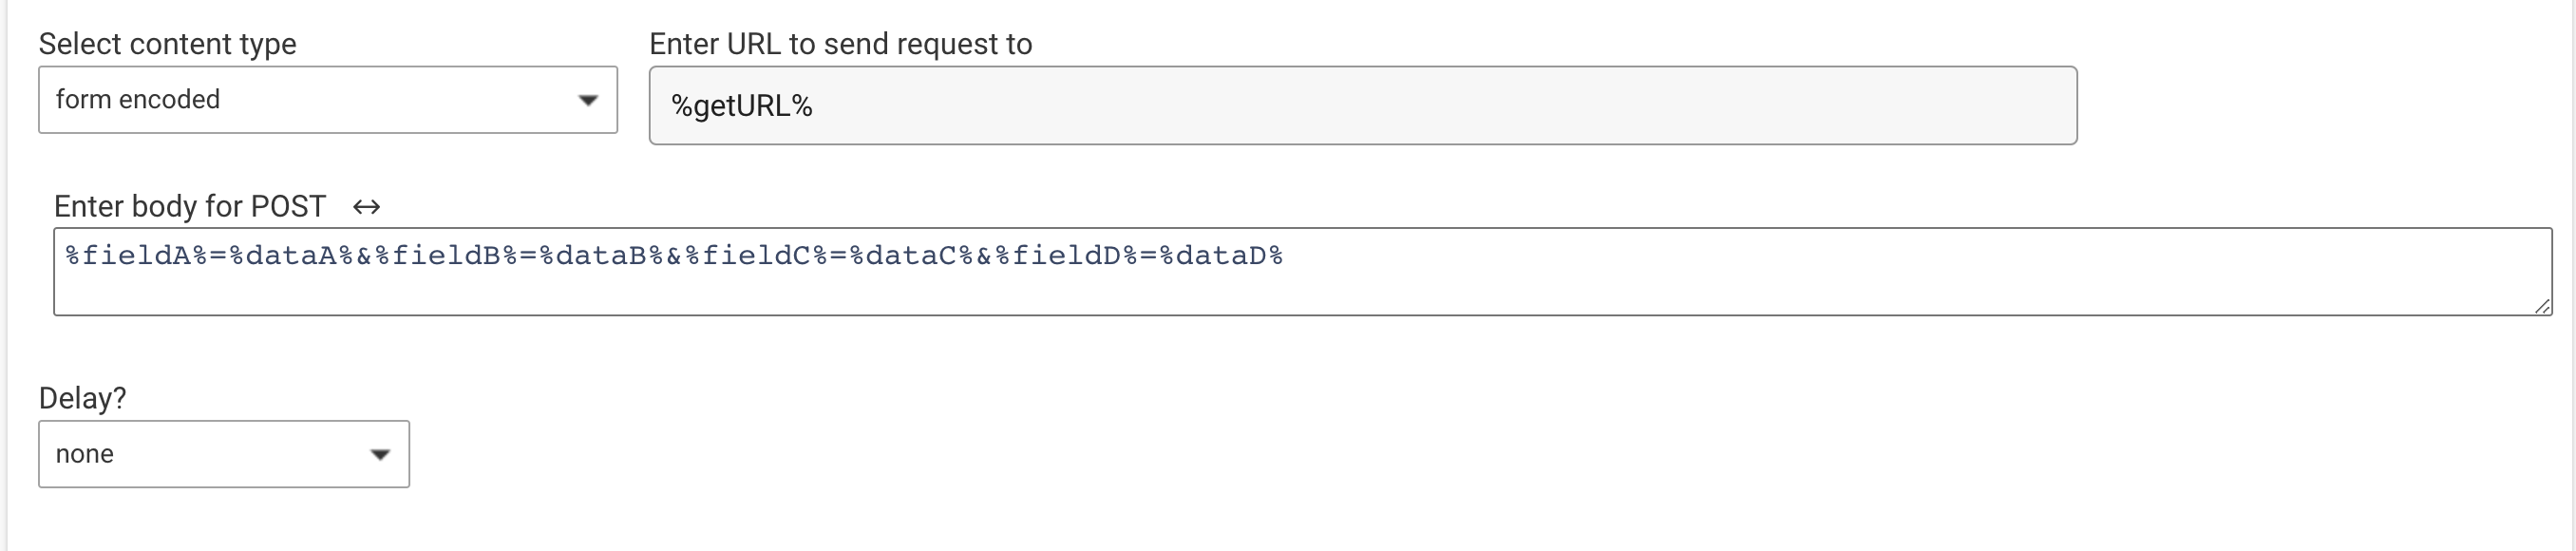
Probably too late, but I decided to give this a try today and came across your post. I had only one issue - I had to use POST instead of GET. Other than that, everything seems to be working well. Not sure if you still need help, but I've attached some screenshots in case someone else faces similar troubles in the future.
I decided to send a new row every time one of the variables changed, instead by time. If I'm happy with the results, I may create a script to remove or collapse the data into a new spreadsheet with an average per hour or something, so I can control the number of rows.
Lastly, I'm not sure if it was mentioned in the original post, but it's very simple to share this in your dashboard by publishing the graph and using IFrameAdvanced.
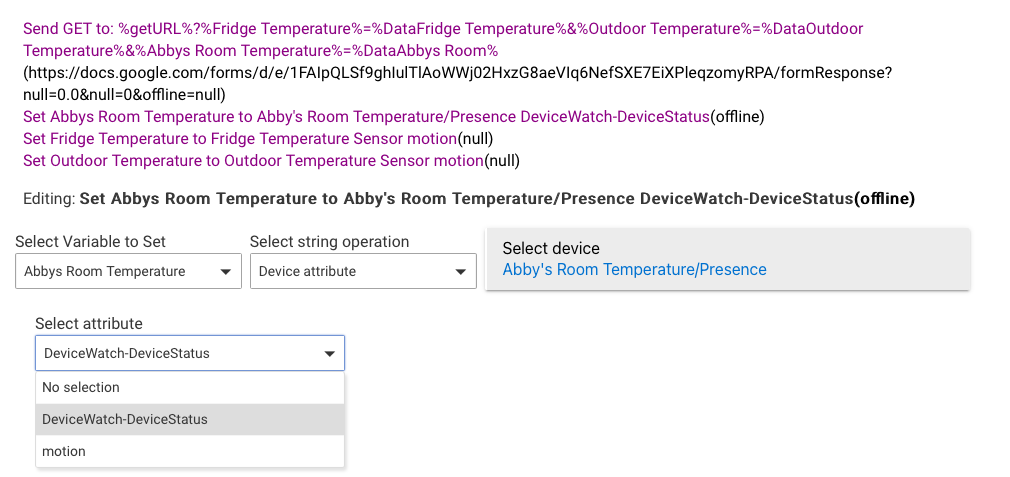
PS: in your post, looks like you are accessing a device that has no value temperature. Maybe that property has no valid value. Check in the device what value has this property. For your screenshots, the values are null
And the trigger is on_change in the document.
I remove the first columns when the document exceeds 10000, leaving the document on 9000.
I will probably make this number lower and maybe use other types of logic so I have last month graph or something like that.
It is an excellent method to have this info and evaluate if it is worth it to create the influxdb solution and maintain another app.
PS: thanks @LibraSun, for the original post! Great idea!
 (Note that the top row were inputted 'initial values')
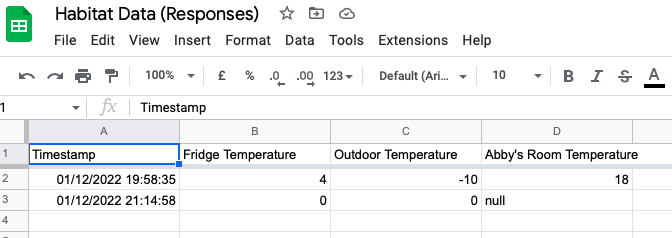