Can anyone help me to troubleshoot this issue? I can't find why the device "hangs" every few days. The only solution is to soft reset the hub and restore the latest database.
This issue has been started a lot of months ago and I am not remember if I was made any modification in the configuration or add any new device.
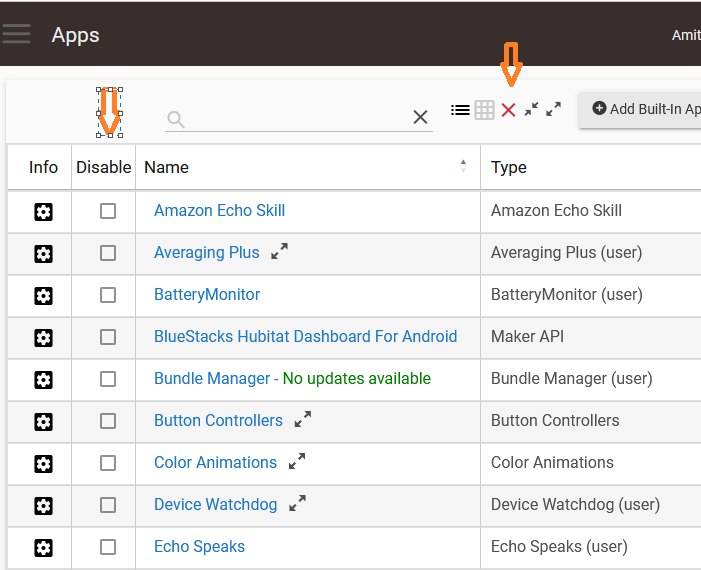
having fought crashes on my hub for waay to long - disable apps is my first best suggestion. use the hidden red x thing.
1 Like
Check the hub even logs for clues to what might be causing the corruption.
Welcome to the Hubitat community, sorry you are having issues.
-
Can you list what apps you have, in particular ones that are community based?
-
Any errors in the logs?
-
Anything stand out in App Stats or Device Stats as far as something consuming memory?
-
Do you have lots of power reporting plugs? What brand are they?
@user6136 Also have you changed power supplies?
1 Like
Hello. Thank you for your time to help me on this issue.
The Apps that I am using is the following:

and the following:

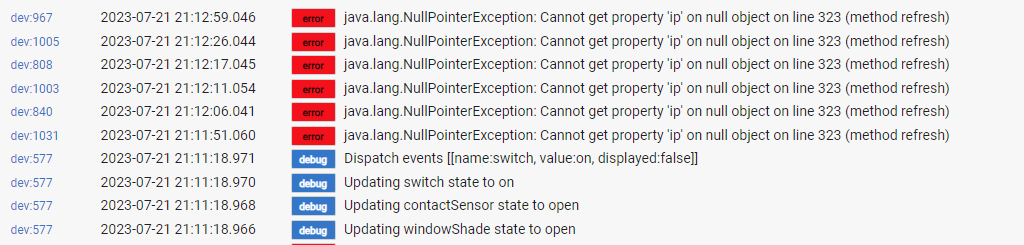
Regarding the Logs I have a lot of Errors... Unfortunately looks like to me as Generic Errors.
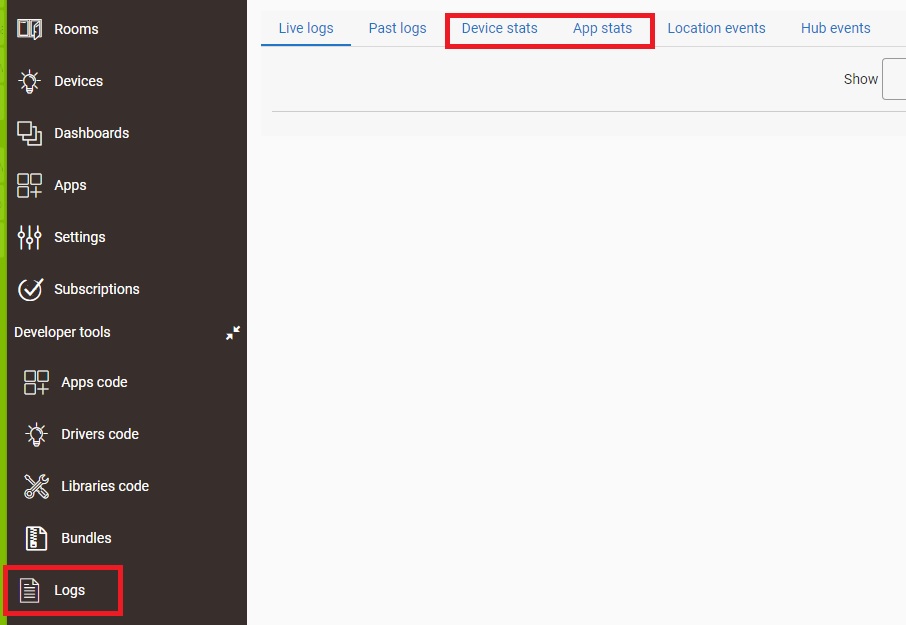
I don't know how can I get App Stats or Dev Stats in order to find out the app that consuming a lot of memory. Can you please hep me to find the Stats?
I have a Central Energy Meter on the Main Switchboard. It is Qubino 3-Phase Smart Meter (ZMNHXD1). I am using also a few Fibaro FGR-223 for Window rolls that are displaying the Power consumption of the motor.
Kind regards,
Any luck sorting your fault?
Click on those red error and see what device is causing the error.
The Device stats and App stats are in the Logs tab, go over a couple columns at the top of the Logs page.
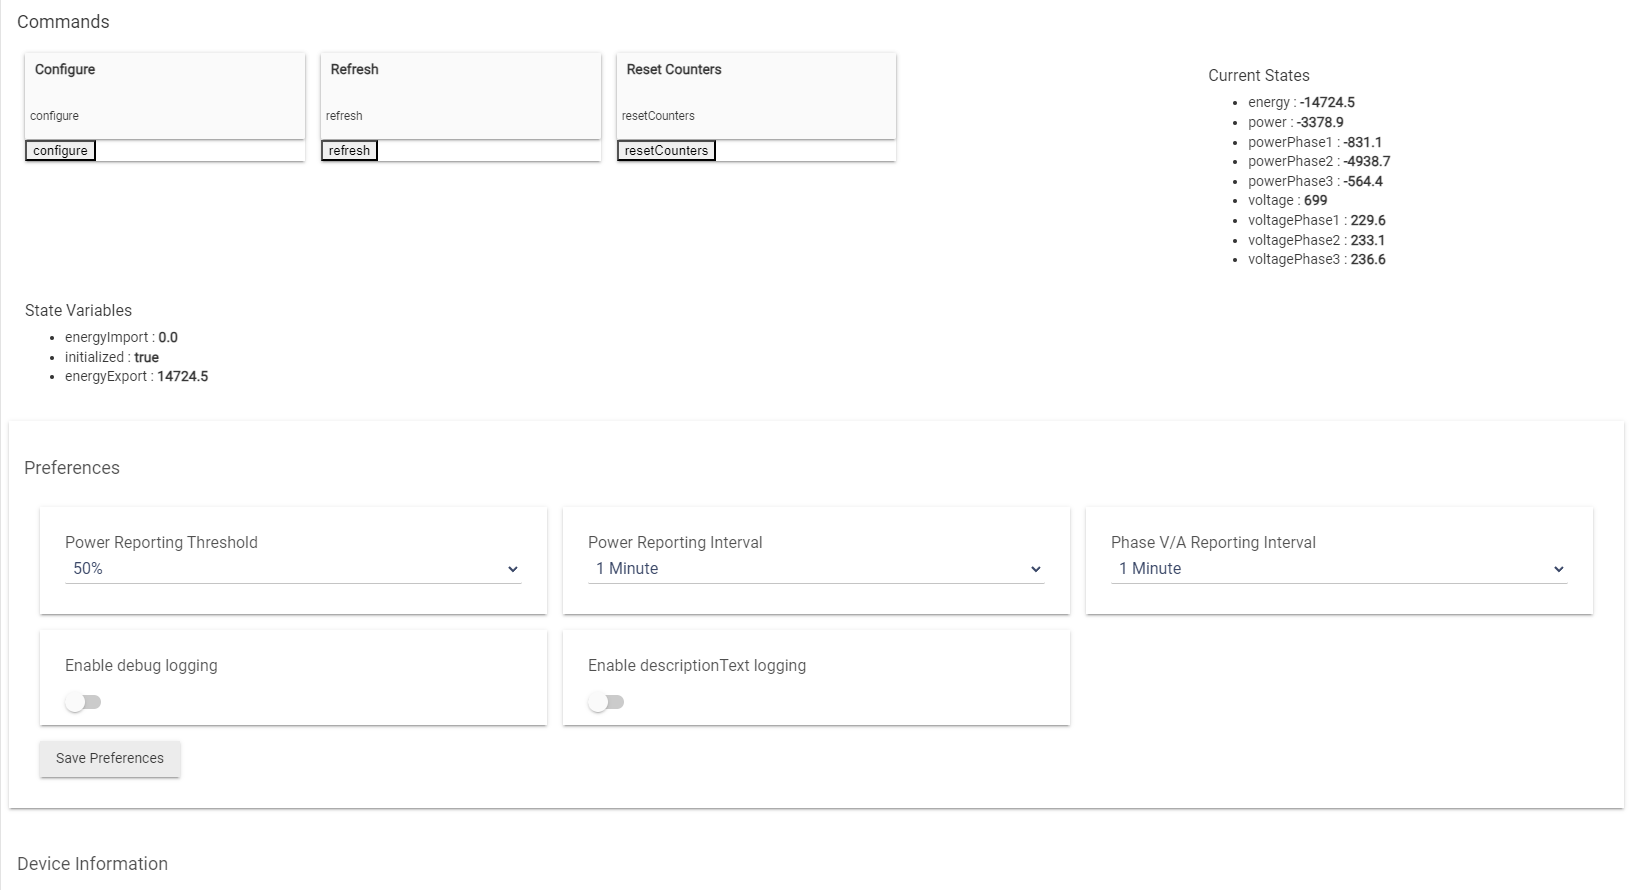
How do you have the power reporting set on those? Could you provide a screenshot of the settings for these?
Same as above, how do you have the power reporting set? Screenshot?
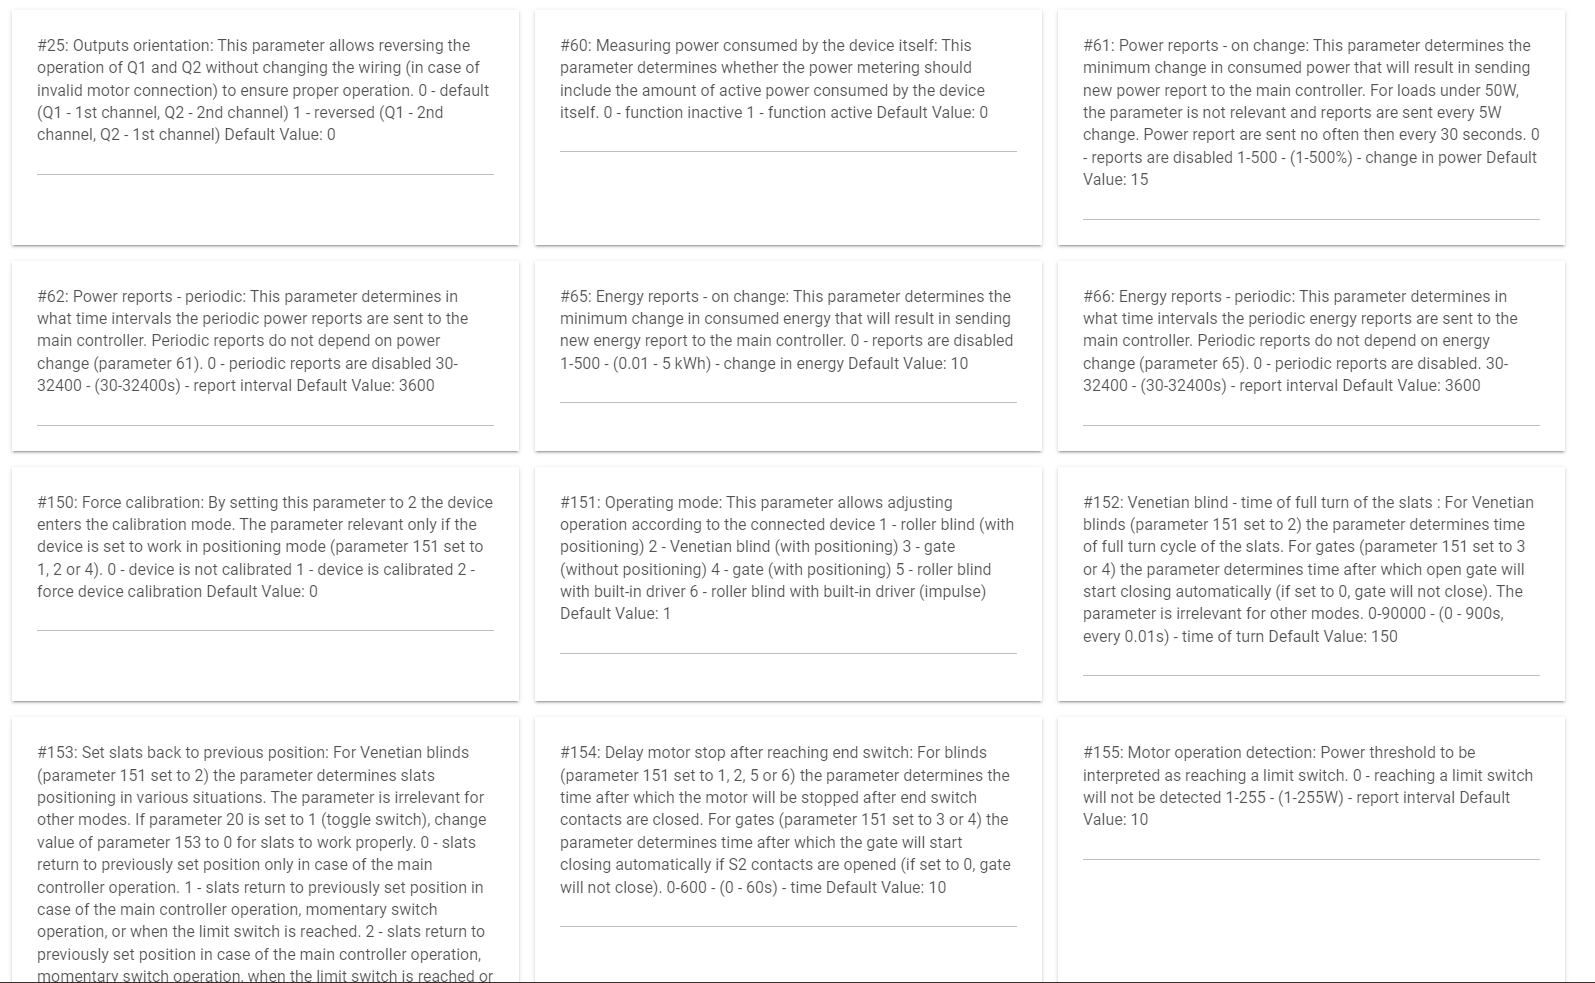

You should turn off ALL power reporting for those Fibaro devices. You are sending 4 power reports for every shade. Why would you even monitor power consumption of a window shade?
I would also disable the Quibino power monitoring for now and see if that makes a difference. You could turn on logging and see how often it is reporting, and I would expect it is a LOT.
Did you figure out which devices were giving the errors in the logs?
For those errors in the log. There seems to a far amount that are the same thing. In the logs the spot on the left were it lists the device:number click on it and it will filter by that device so you can find out which one it is. What is it? And what kind of device is it.
Following your suggestion, I re-configured all the devices were generating a lot of Logs, including the devices were reporting power consumption. I have also removed old Drivers that I am not using any more and I have Updated the drivers for other devices. Can you please inform me how many devices this HUB can handle? Is there any monitoring of the CPU or Memory Usage? Can I add a secondary HUB in parallel?
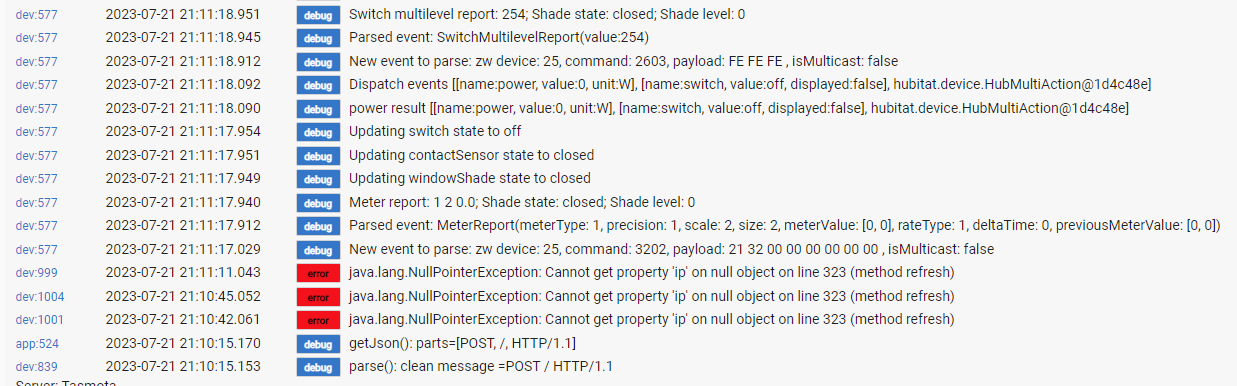
I have also 15-20 sonoff mini that I am using with the latest firmware of Tasmota and the "Tasmota Generic Switch" driver from AwfullySmart com - HongTat Tan. The devices are working very good, are cheap and reliable but they are reporting a lot of logs like the following:

For that I would post in one of the tasmota threads.
1 Like
zigbee 32 devices per repeater. z-wave 256. Lutron unlimited (limited to 75 per lutron hub though). lan unlimited.
If you want to watch memory usage, install @thebearmay 's Hub Information Driver (available in Hubitat Package Manager)
Yes you can run as many Hubitat's as you want and turn on Hub mesh. But to give you an idea of my own personal hub load
1 Hub
64 (so far) Zigbee Devices
61 (so far) z-wave devices
57 (so far) Lutron Devices
14 or so lan integrations
20 or so virtual devices
Around 75 rules (so far)
Average hub cpu load less than 4%
Memory is fine. I really only have to reboot with platform updates.
1 Like
This topic was automatically closed 365 days after the last reply. New replies are no longer allowed.

