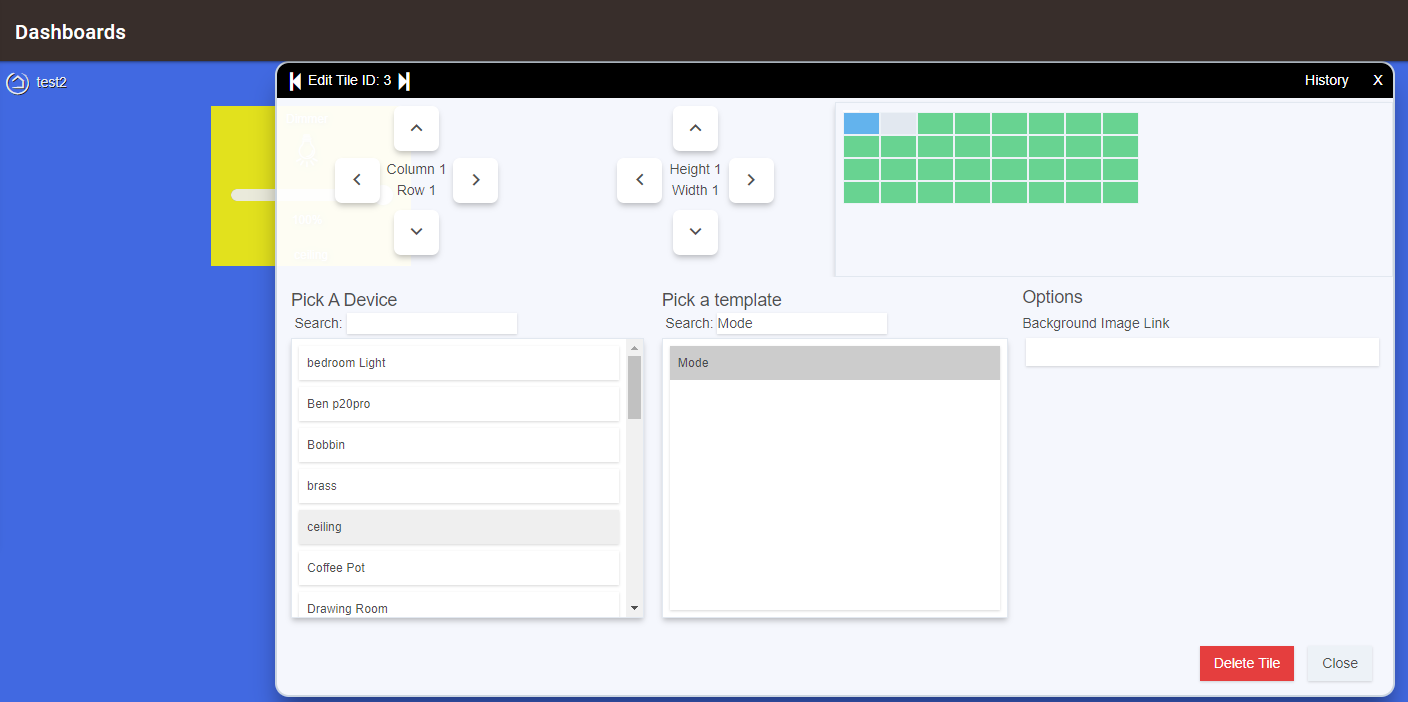
New to Hubitat, and enjoying so far, but the dashboards are driving me mad. When i first got the hubitat i couldn't see the mode tiles. Re-booted a few times, and they came back, and everything seemed fine.
However, it's broken again! I've updated, re-booted etc... but the mode tiles simply don't display. They are there when i view the tile configuration. There is no device, just the template set to mode as per this forum...
Has anyone seen anything similar, it's becoming really frustrating without it!
Go to the cog in the upper right corner of the Dashboard and open the Advanced tab. Copy the JSON from the text field there and paste it using preformatted text in a message. With that information maybe we can get closer.
Ok, I can confirm that there is nothing wrong with the config generated for the Dashboard, that config works on my hub.
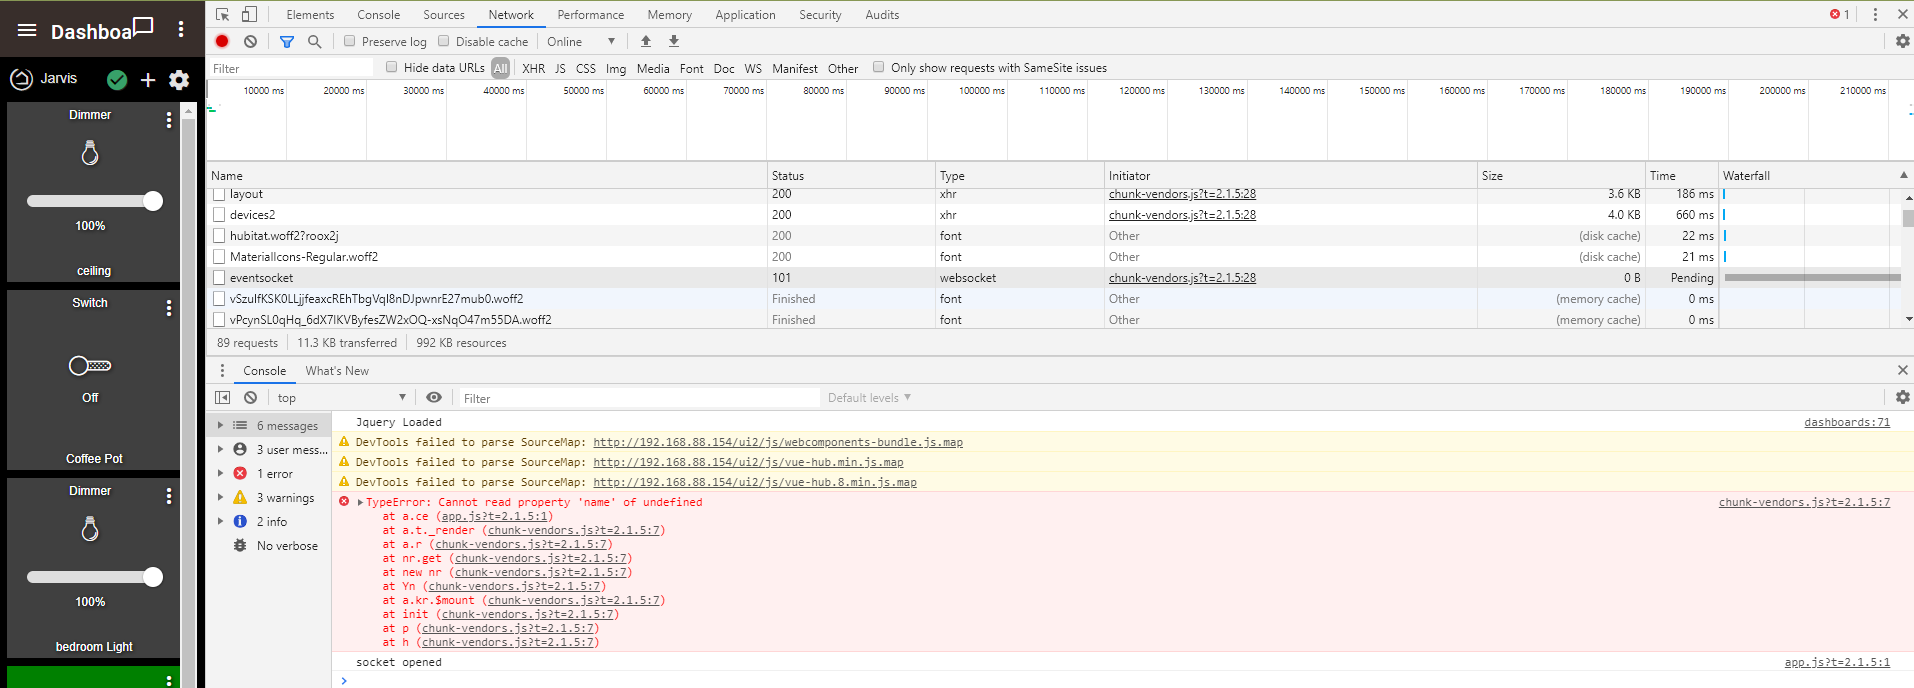
If you open the Inspector in your browser and look at the Console when you refresh the Dashboard, do you get any errors there?
Yes, this is not a normal issue, I've not seen it, but that doesn't mean anyone else don't know what this is. I will check again if I can figure it out later today when I have time again.
Looking at this again and reading what you did to have it working temporarily and the fact that the config is 100% correct since that JSON works if I paste it into my hub, the only thing I can think of would be DB corruption, do you have Error 500 showing up anywhere? If you check the Network tab of the Inspector in your browser, do you see any of the resources loading there having a status of not 200 or Finished? If you have anything with a status of 500 there when you refresh the Dashboard we'll take it from there.
I have time intermittently today, plenty of phone meetings...
So when u said about things not loading, there were 3 warnings in the console too... (Should have copied them first time...)
See below:
dashboards:71 Jquery Loaded
chunk-vendors.js?t=2.1.5:7 TypeError: Cannot read property 'name' of undefined
    at a.ce (app.js?t=2.1.5:1)
    at a.t._render (chunk-vendors.js?t=2.1.5:7)
    at a.r (chunk-vendors.js?t=2.1.5:7)
    at nr.get (chunk-vendors.js?t=2.1.5:7)
    at new nr (chunk-vendors.js?t=2.1.5:7)
    at Yn (chunk-vendors.js?t=2.1.5:7)
    at a.kr.$mount (chunk-vendors.js?t=2.1.5:7)
    at init (chunk-vendors.js?t=2.1.5:7)
    at p (chunk-vendors.js?t=2.1.5:7)
    at h (chunk-vendors.js?t=2.1.5:7)
ie @ chunk-vendors.js?t=2.1.5:7
app.js?t=2.1.5:1 socket opened
DevTools failed to parse SourceMap: http://192.168.88.154/ui2/js/vue-hub.8.min.js.map
DevTools failed to parse SourceMap: http://192.168.88.154/ui2/js/vue-hub.min.js.map
DevTools failed to parse SourceMap: http://192.168.88.154/ui2/js/webcomponents-bundle.js.map
Sourcemaps don't exist, so that part is fine.
The other part looks like data retrieved by the JS code from the hub not existing as expected. That you have the same issue on multiple devices makes it sound like the hub can be the only culprit. The network tab of the inspector, anything not saying 200 or Finished in there?
If you have a normal consumer home network then just disregard this question: Do you have a forced transparent proxy all your traffic go through or some other possible thing in your network blocking communication with your hub?
Oh, random thought... If i delete tiles, then they don't delete, even if i refresh the board. only when i move off the board and come back do they actually disappear... (This didn't really bother me, but given your exploring how this all hangs together thought i'd mention it...)
There is no firewalls or anything between my end user devices and the HE.
Isn't that fun We've now eliminated that there is something wrong in getting data from your hub, what is left is the data itself. 101 is correct for websocket, it's protocol-change status code. I should have mentioned that one as ok as well.
This is not right, they should be gone as soon as you delete them.
At least I wanted to ask, if you had something as crazy and strange as my own setup, things could easily go wrong, so just wanted to be sure. But that is also why I asked if it was a normal consumer network and to disregard the question otherwise, confirmed, nothing strange with the network, and those status codes confirm that again.
Now to the final troubleshooting stage BEFORE recommending that you download all backups you have on your hub database and do a Soft Reset.
Go to Apps and open the Child App for the test Dashboard you made where you still had this issue. There unselect "Use all your devices" and choose only the one device you need for that Dashboard. Go back to the Dashboard, Refresh the page fully and if the issues are still there it is Soft Reset time.
Don't forget to download ALL backups, or if you have them all already downloaded, no need for that again, of course. Once you download all backups currently ready (there are 5), click the Download from Create New Backup area. Now you have your data as secure as can be.
If you've never done Soft Reset before, here is the official guide: https://docs.hubitat.com/index.php?title=Soft_Reset
So i followed those instructions and did a soft reset. Restored the backup, and same thing happened. I tried a second soft reset and did not restore initially... in this time the tile appeared. I have clearly screwed up the database somewhere in the mode settings. thoughts of things i've done.
I have changed the standard modes. I did delete some, (perhaps all) before adding ones that made sense to me. (Sorry new user!! )
I removed and put the mode manger back. no change
I guess i am at a point where i need to clear the "Broken" data, but would be really useful to know what i broke, so i don't do it again! Also, if there is any way to grab the device and rule machine data, so i'd not an onerous task to set that all up again...
Do you see anything weird in the logs when this happens? If you don't it might be time to @ bravenel (Bruce) and ask him if there are any bugs to be encountered when all OOB modes are deleted.