aye - i'm still 2.4. except for some dev work last week - I was nearly 80 days without any issues. Longest period for me ever!
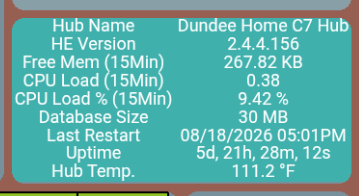
I actually never had to reboot before 2.5 unless it was for a specific issue unrelated to memory (update or I remove an app and want to just clean up the database, etc). I now rarely make it past 2 weeks before I am below 300 Mb. Before, I rarely got below 350 Mb. Since 2.5, I start below that.
Pretty much the same for me on my C8P. I had it reboot once a few weeks ago. That rarely happens.
With release 2.5.1.152 at first a saw a longer, more shallow memory loss, and it leveled off around 875 mb. Then three days ago at midnight it suddenly jumped up to 1000 mb with no explanation. I couldn't find any reason why this happened. There wasn't a reboot, and nothing much is going on at midnight. It remains a mystery. Since then it's been dropping faster and I haven't seen it level off at all yet.
Every time I post on this thread the forum software asks me if my question has been answered. Uh... no.
Here the busiest C7 boots at 220 or so and hovers for days/weeks above 170MB on 2.5, where it used to drop much lower before (in the 70's, yet still chugging along). The C8P drops a lot, but never makes it to those kinds of numbers between platform updates.
I've basically stopped looking at memory. CPU load, on the other hand, creeps up over time and ends up causing issues on the C7, not memory.
Prior to 2.4.4.155, I would boot at close to 500 (usually in the 480's), and never get below 350 between updates (the only reason I would actually reboot other than after making changes like removing apps or devices and I just wanted to clean out the memory)
I had an alert set to let me know at <300 based on that.
After upgrading to 2.4.4.155, I started getting low memory warnings. It was this that prompted me to download watchtower for tracking.
2.4.4.156 made it slightly worse, and the 2.5XX versions made it much worse. I rarely boot up at over 350, and quickly run below the three hundred mark into the 280's within a week or two. I usually reboot with a DB rebuild at that point as I would rather not let it get so low that I notice performance issues just to find out what that limit is.
The only things I have added since then are FP300 Occupancy sensors and the Chromecast+ Beta app. Both happened over a month after the drop in performance. While I can see an additional and persistent hit to the running CPU usage from the chromecast+ app, the memory drop has not changed for the better since 2.4.4.155. Unfortunately, I did not catch the version stats well enough to roll back that far. I had already done too many upgrades to roll back to any 2.4.4X versions.
Not a complaint. Just an observation that I now have to look at things I never had to even worry about before.
You can roll back to 2.4.4.156. there is a way to do it using an endpoint if you really want to. I don't remember the endpoint off hand and my bus is here to take me back to the campground.
Is there one for prior to 2.4.4.155. I should have been more specific
Also, this was more for testing purposes at the time to more or less validate what I had been seeing. I do not think reverting to an older version is a good long term strategy.
I think the only 2.4.4 version available is 156 because it was the final, and for me, the best version so far. I think you have mentioned 154, or around there, as your better version. We have discussed this. It seems it's different for each of us, probably depending on what's on out hubs.
I try to stay current too. That's why I'm now on 2.5.5 since I can at least get a few days, and I can probably control when, before I need a reboot.
And I thought this was current? Guess not! LOL
Using vibe coding at Gemini, I have developed a metric collection and graph app that monitors metrics at given interval, and can detect and auto annotate reboot and upgrade events.
Below is my graphs for the latest month (it hasn't run that long):
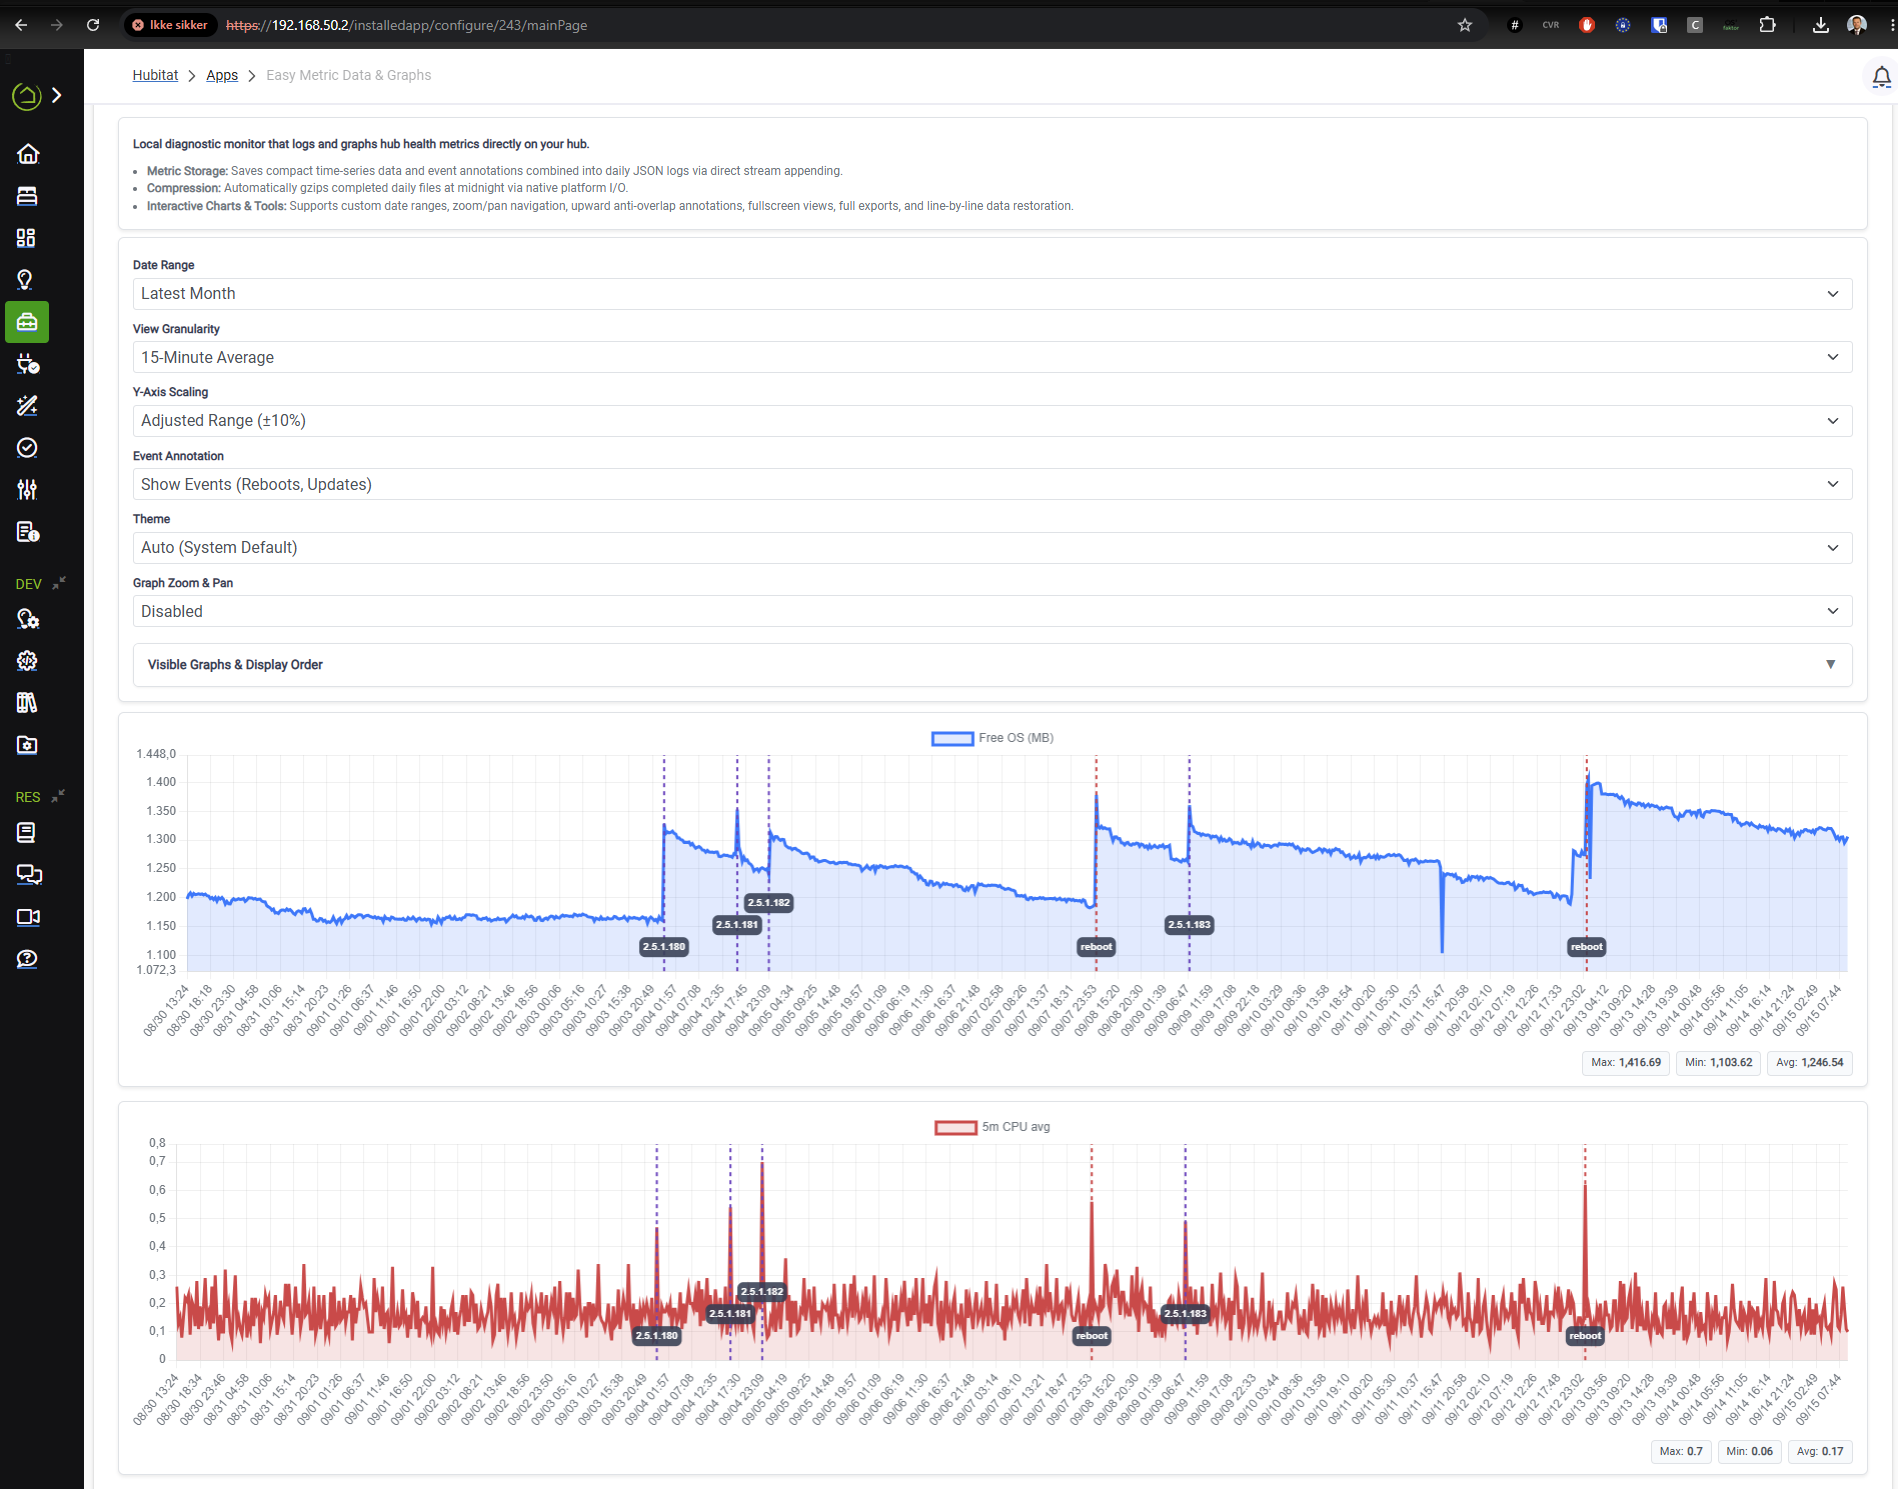
It still looks like there is a memory leak on C8 Pro.
Memory leaks can happen from OS itself, but also apps and drivers (I guess).
Is there any native endpoints my app can monitor for driver and app consumption (without using Make API)? If so I would like to implement monitoring of these too 
I plan to make the app available via HPM in time
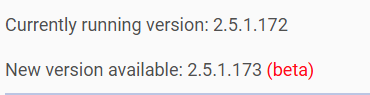
I've hopped up to 2.5.1.183 after seeing this in the release notes for 2.5.1.172:
The C7 has been up for four days with much better looking memory behaviour. Keeping my fingers crossed.
It lasted to the early hours of this morning, so about 16 days, which is far better. This time it stopped working with a "Zigbee Network Offline" error and nothing about low memory.
Memory leak is still there 
I have/use:
- Devices
- about 70 devices (all Zigbee - Zwave and Matter disabled)
- simple bulps, strips, motion (IKEA) and temperature/humidity (Tuya)
- about 70 devices (all Zigbee - Zwave and Matter disabled)
- Apps:
- Battery Monitor 2.0
- Easy Dashboards
- Groups and Scenes
- Hub Metric Data & Graphs
- Hubitat Package Manager
- Hubitat® Dashboards
- Integrations:
- Chromecast Integration
- Google Home Community
- HomeKit Bridge
- Automations:
- Dimmer Button Controller
- Rule Machine
- Webcore (only for temperature graph)
- Drivers:
- IKEA drivers by dandanache
- Tuya Temperature Humidity Illuminance LCD Display with a Clock by kkossev
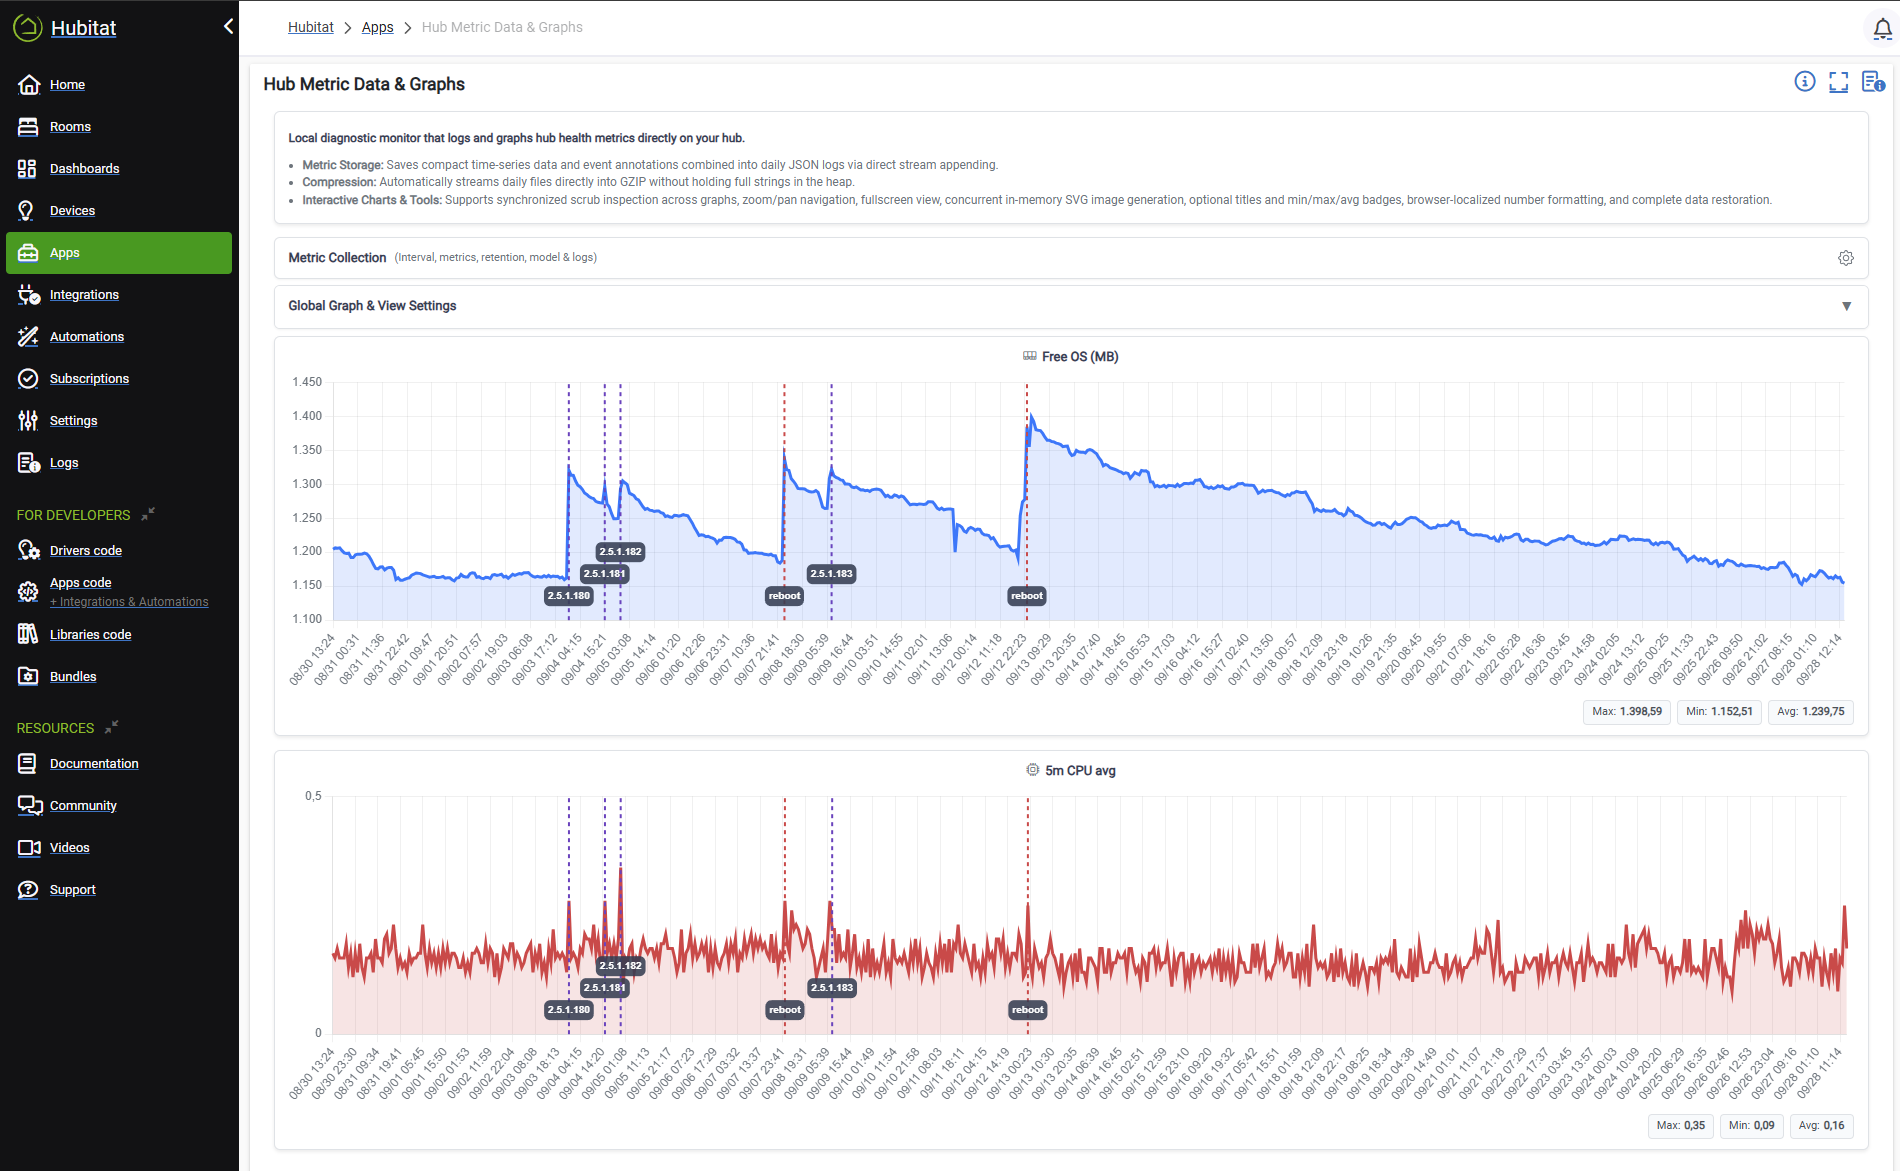
A simple setup and the memory leak is about 100 MB pr. weak.
Cool memory/CPU graph.
Lack of in-box history graphing is why I pump all of my hubitat devices over to Home Assistant.... So I can easily graph them.
Would be nice to be able to do a few of them (like hub memory and cpu) on the hub itself though.
EDIT: In terms of memory leaks, I can't help there. I tend to reboot my hub every few weeks/at least once a month, so if there are memory leaks they don't really impact me so I don't worry about them.