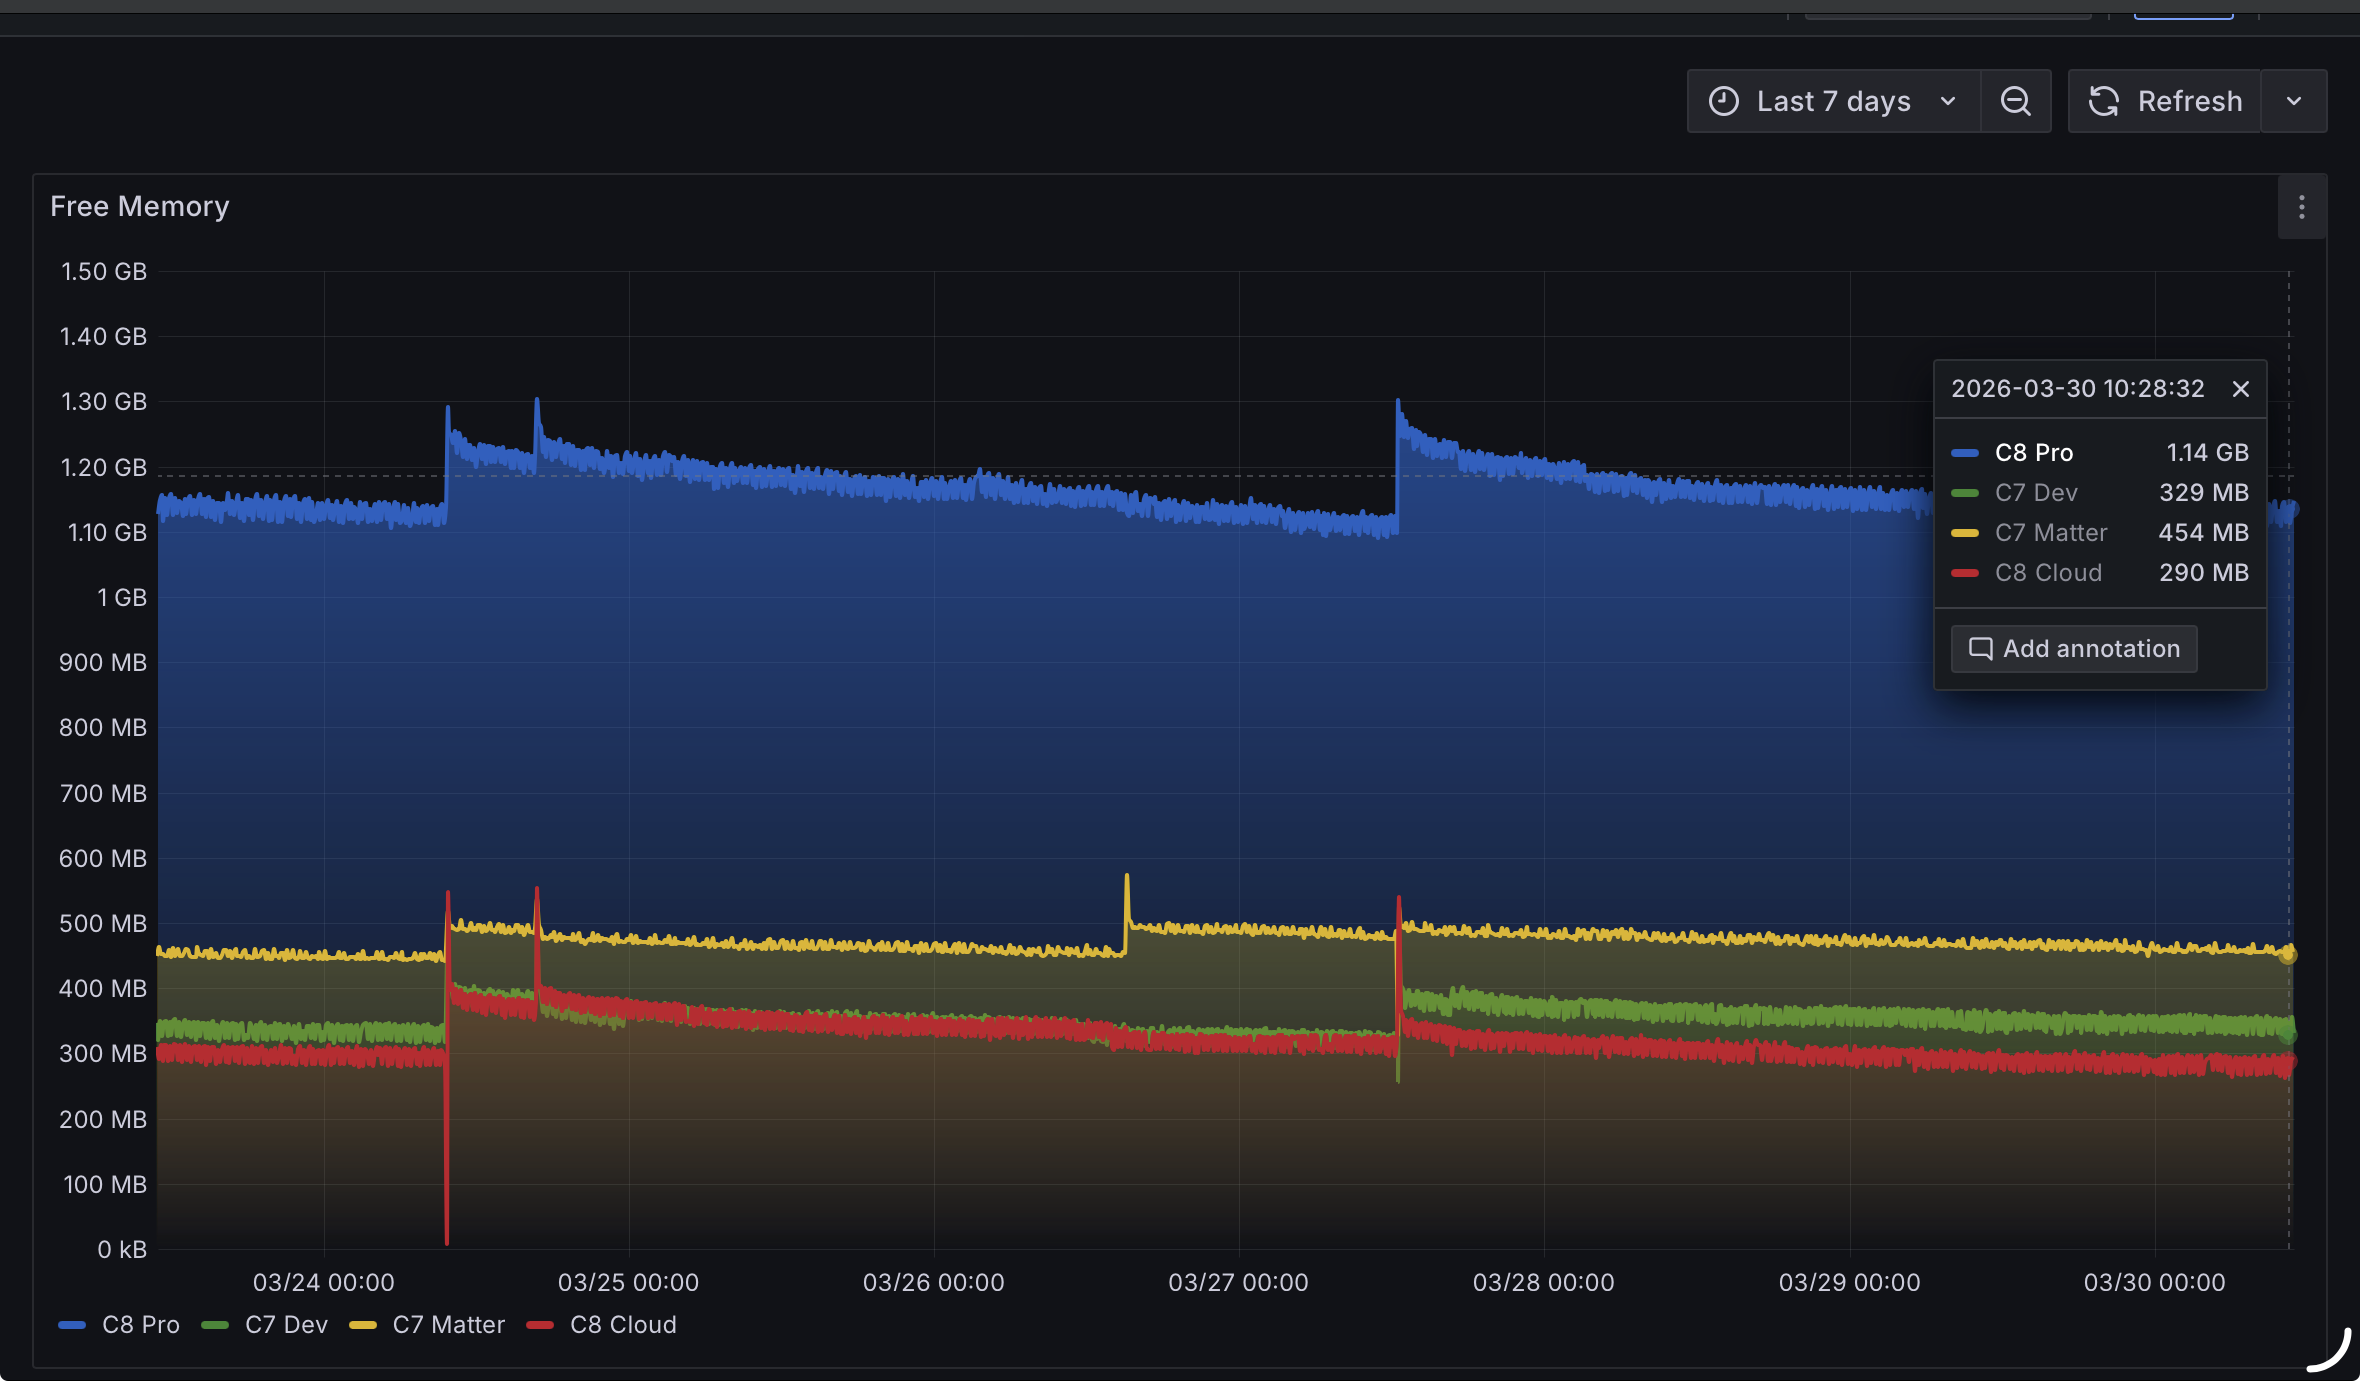
Lucky! I dream of having more than 800mb after a few days...I reboot after an update to at best 1GB and fall from there. Matter, Homekit integration, Z-Wave/Zigbee, no BT stuff. 
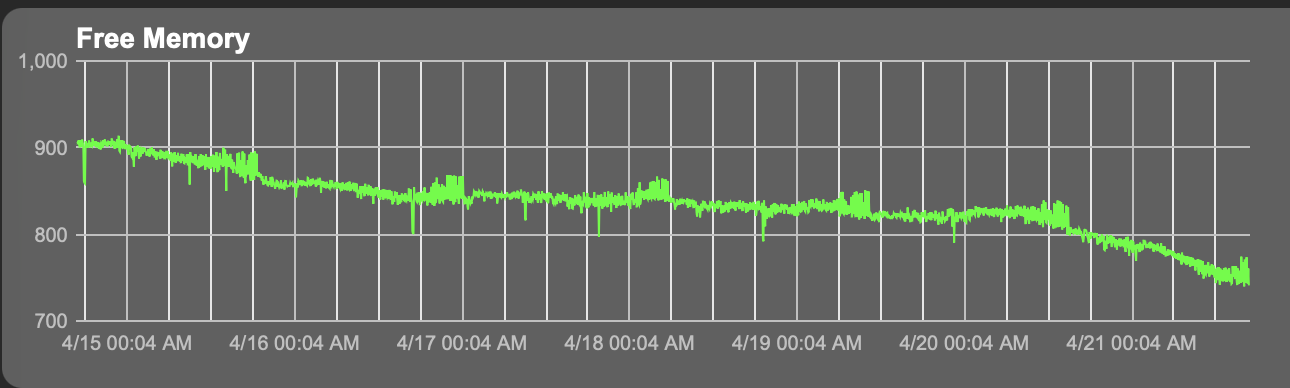
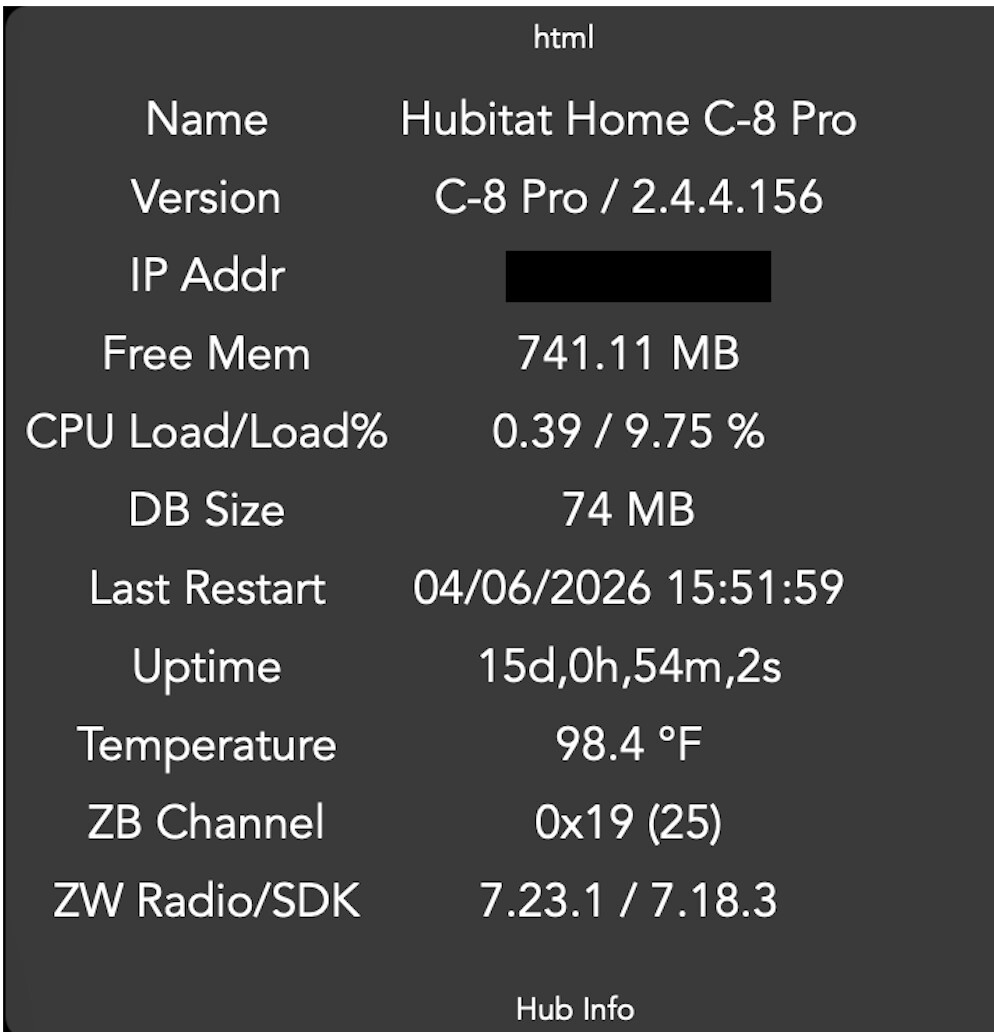
On 2.4.4.155, last five days or so:
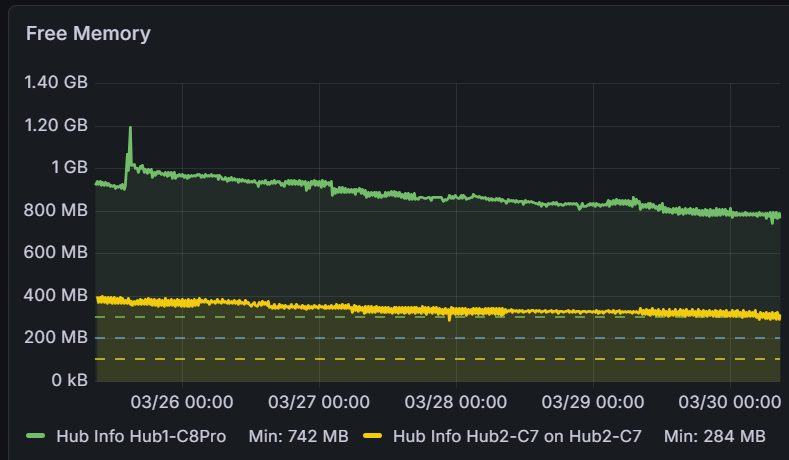
Very recent: Too soon to tell but might be finding a stable sawtooth around high 700's (but I've been hurt before).
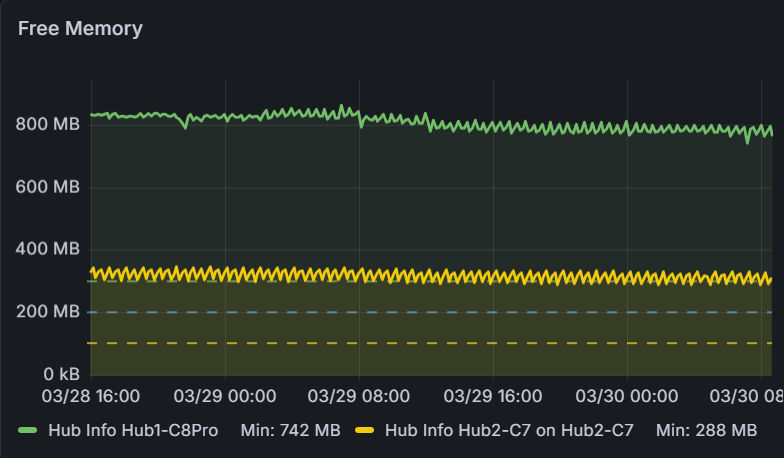
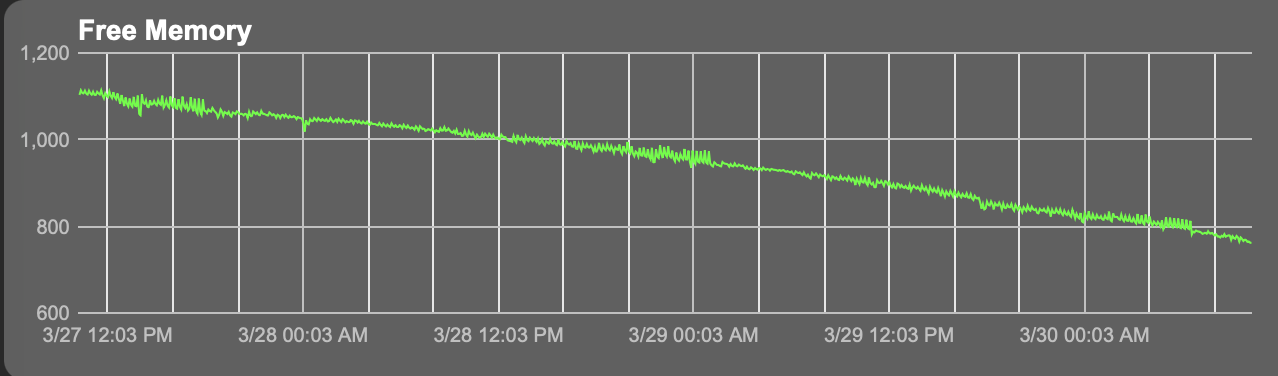
Wow...you are "winning."
In this case I think I'd prefer to lose.
I had to reboot to get a Shelly bluetooth device to come back on line. I'm back to 1200 mb free memory. We'll see what the trend line says now.
I'm going to do a reboot as well, actually a full shut down/pull power/restart.
I'm sure @gopher.ny is looking into this stuff.
That's what I did. It will take a while to see if that helped. So far it's not dropping precipitously. We shall see.
This morning it seems to be behaving itself quite nicely. Of course time will tell. But no drop like the last few days.
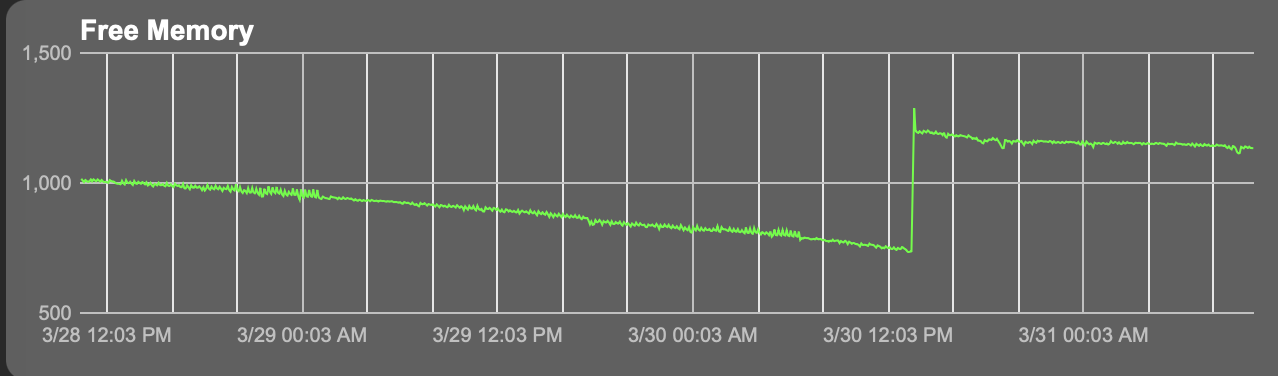
Really too soon to tell, but doesn't look too promising...the slope after a shut down/pull power reboot looks similar to previous tries.
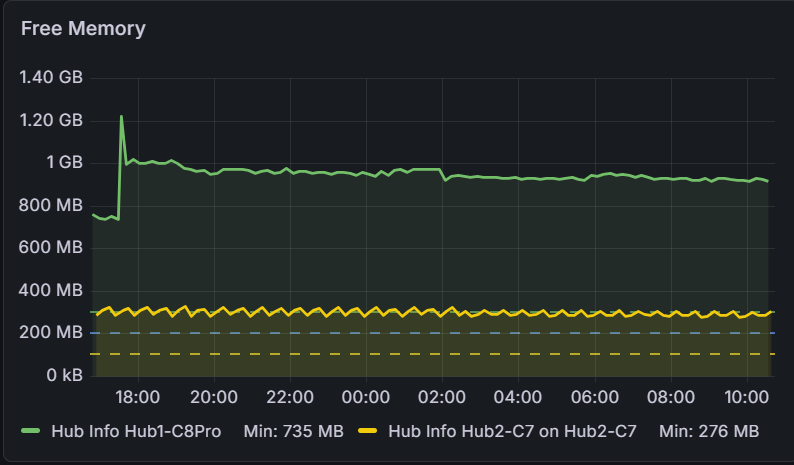
I have 3 days in on .156 and only down about 80M.
I have one SwitchBot Matter device, 100ish ZW/ZB combined, no BT and 4 WiFi bulbs.
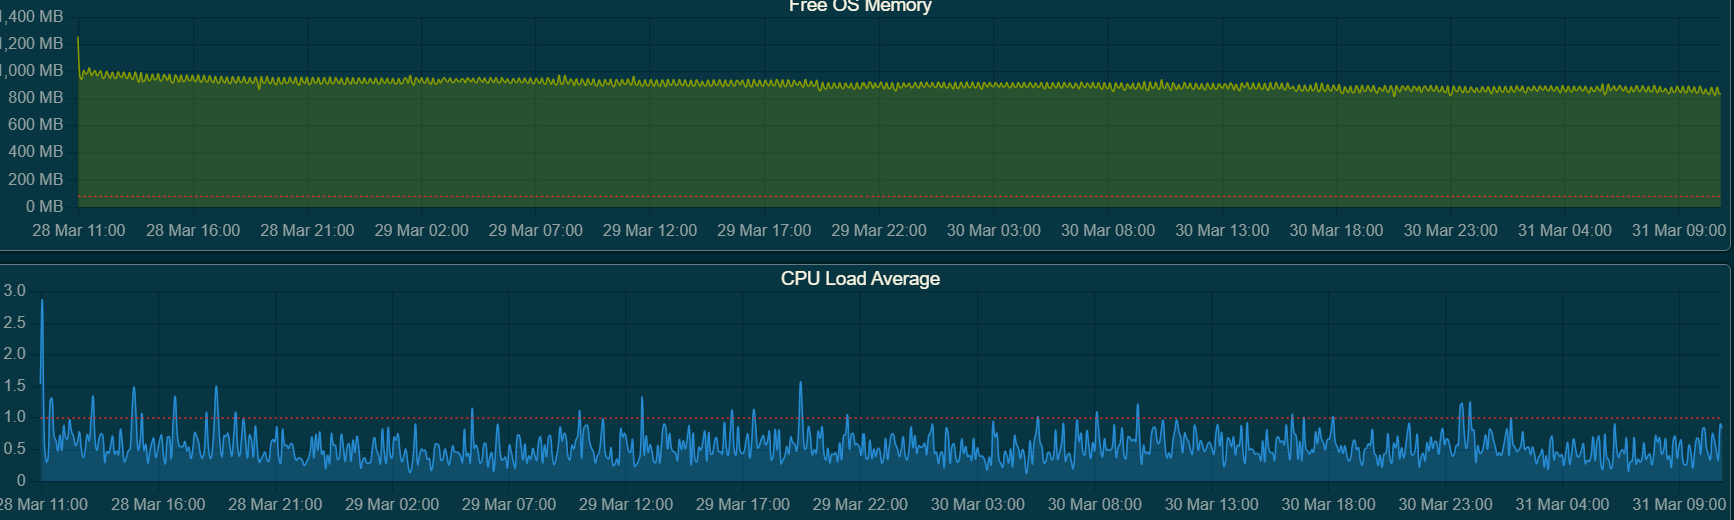
2.4.4.156 initially showed very high CPU after install and a reboot or two and a couple crisis situations. Now, CPU back to normal after latest reboot. 
Still seeing pretty consistent downward drops in memory. Recently, the worst culprit is the built in Hue integration. Of course its "only" 25-35% of the 50% of app CPU usage, but it beats out the next app by a dozen %. or more. Quick related question: is total App % + total Device % + ??? = Total % that triggers warnings? My assumption (and you know...) is that my 40% app + 40% device and x% system was giving the nearly 100% usage. Correct or way off base?
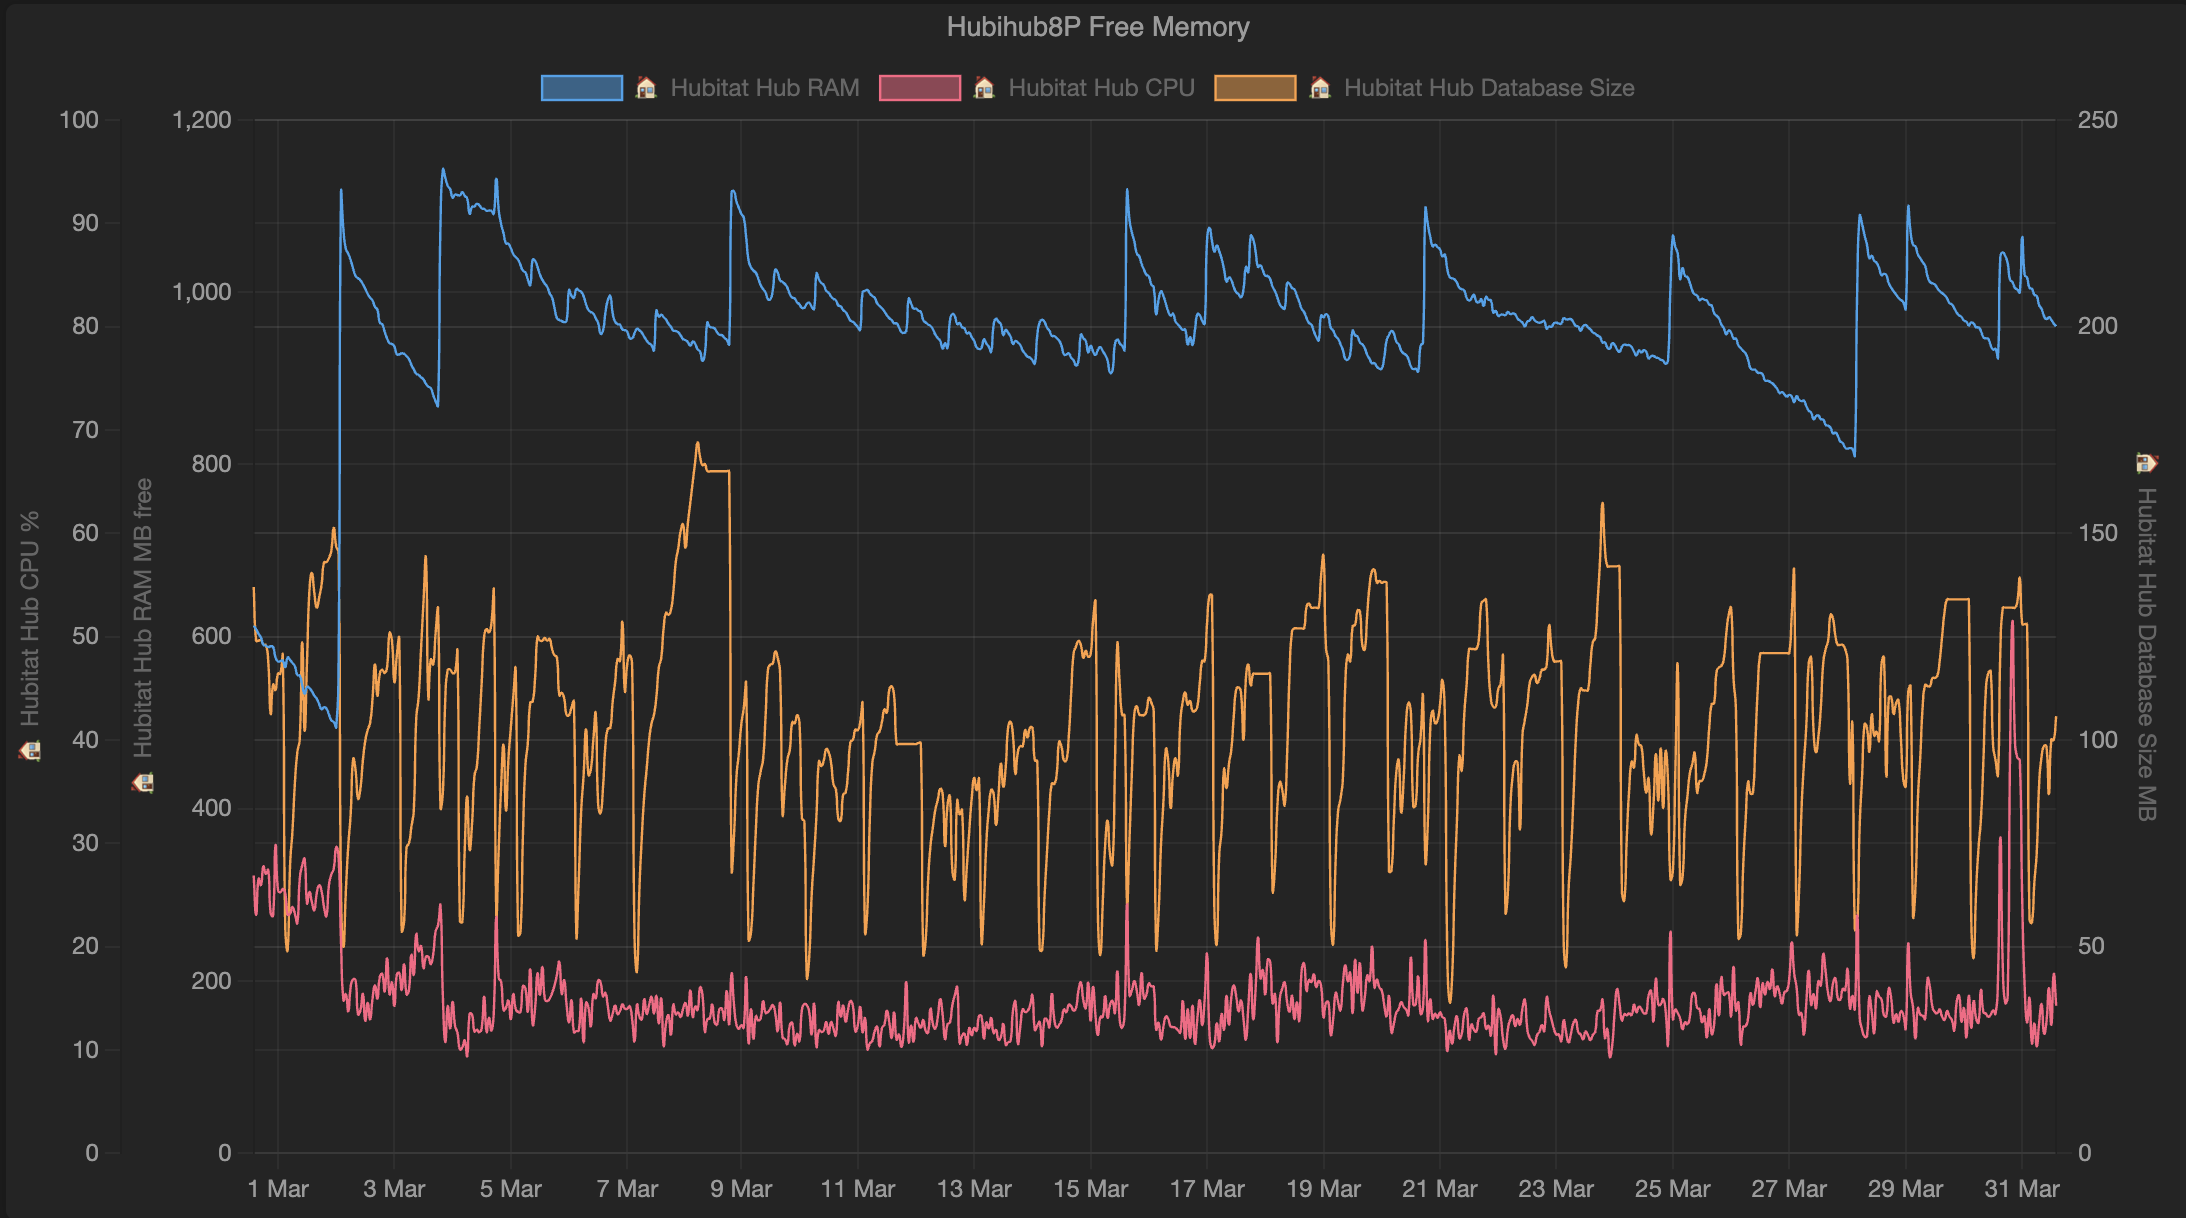
Curious on the DB size you have.
I'm always well under 100 normally, I'm at 114 ATM which is unusual.
You are 2-800?
DB size is in orange and the scale is on the right. Swings wildly between 40-150 MB.
Doh!
Not seeing any improvement, here. Just a steady drain. It did level off for a few days, which gave me hope. But it has resumed the downward trend. My hub is definitely not overloaded.
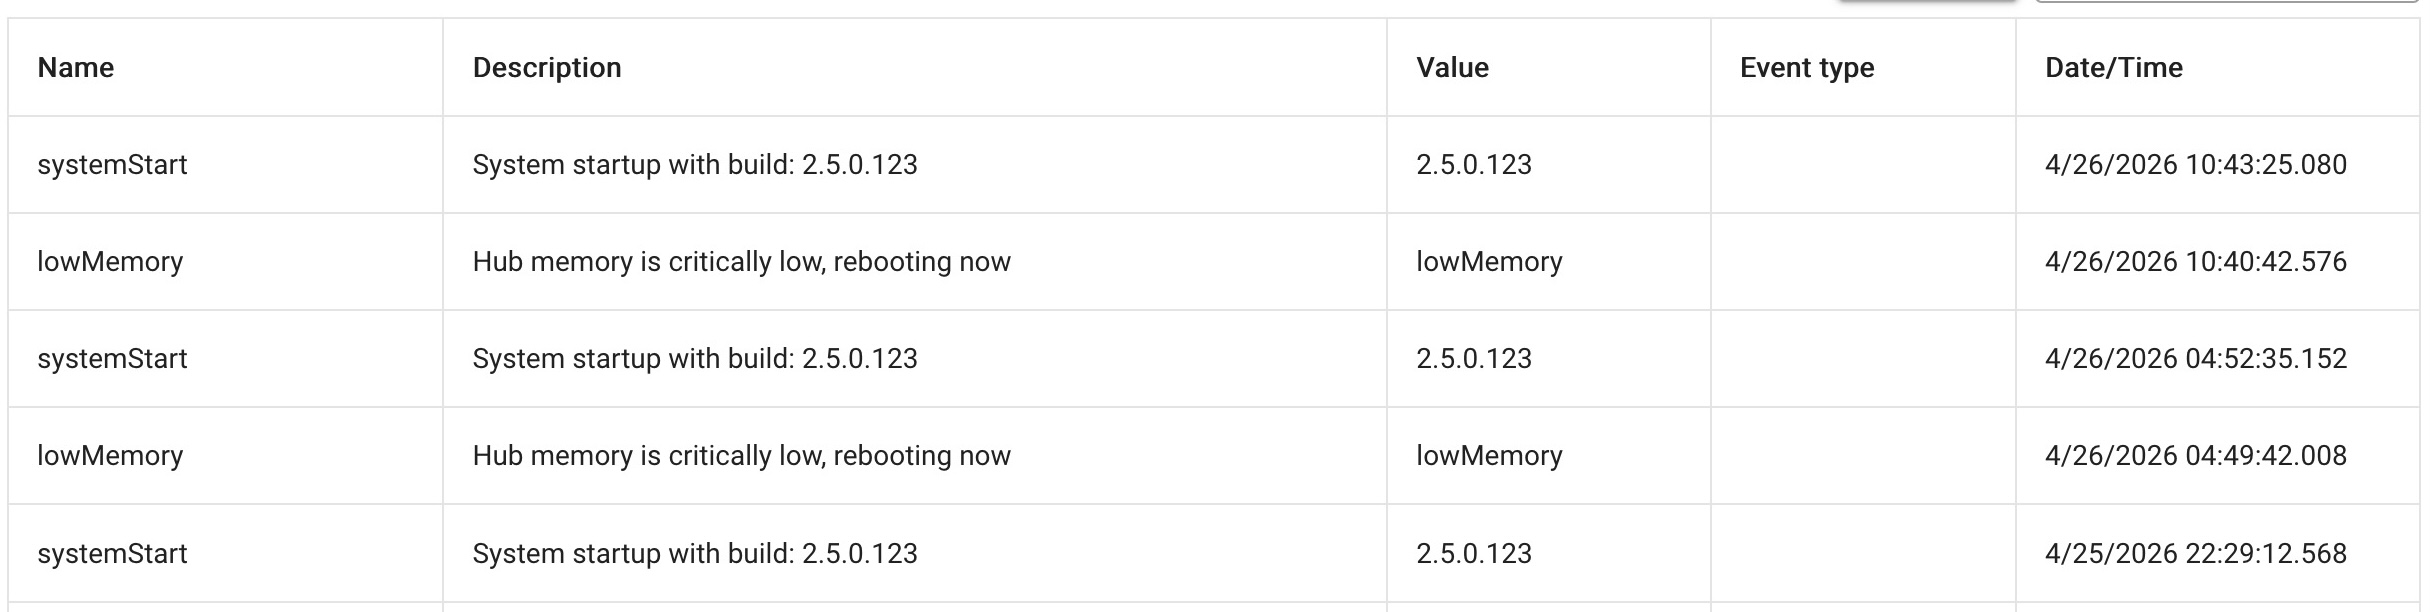
Going to keep an eye on this, as I've been seeing lowMemory reboots with both 2.4.4 and 2.5.0 on my C7.
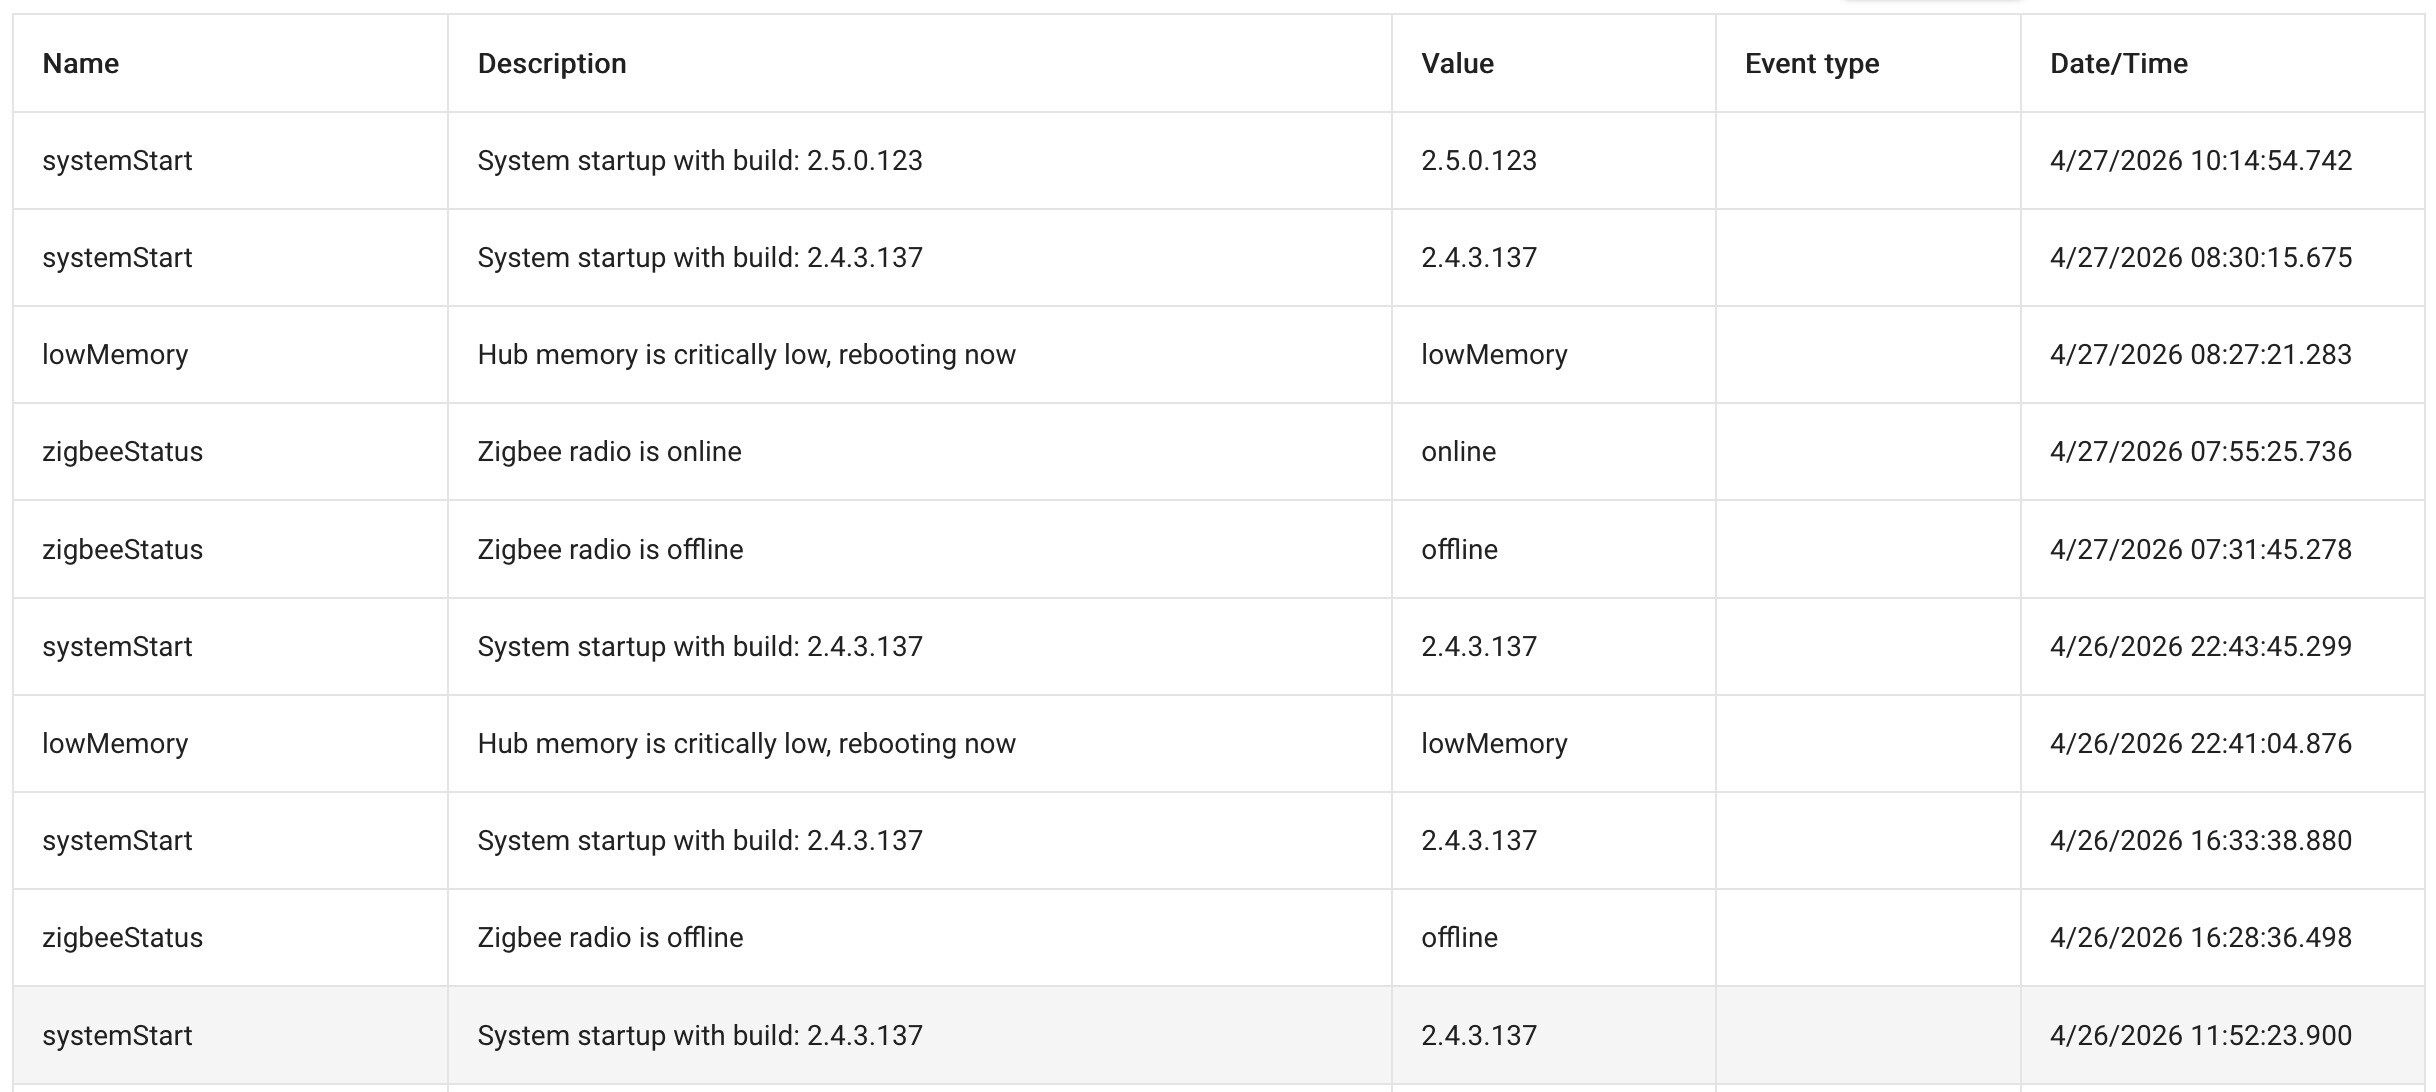
Dropped it back to 2.4.3.137 (the earliest available to me) as I wanted to rule out the firmware, but then found this thread.
Left this a day and the leak seems worse with the older release. Updated the C7 to 2.5.0.123 to match my C8 Pro, which is also having difficulties.
This is the C7 with 2.4.3.137, you can see my update at the end. There's virtually nothing installed on the C7, it just runs my AlertMe gear and pushes it out to the C8 Pro via Hub Mesh.
This is the C8 Pro. You can see it lasts longer, but then it has more memory to burn. Not sure what the upnp stuff is all about.
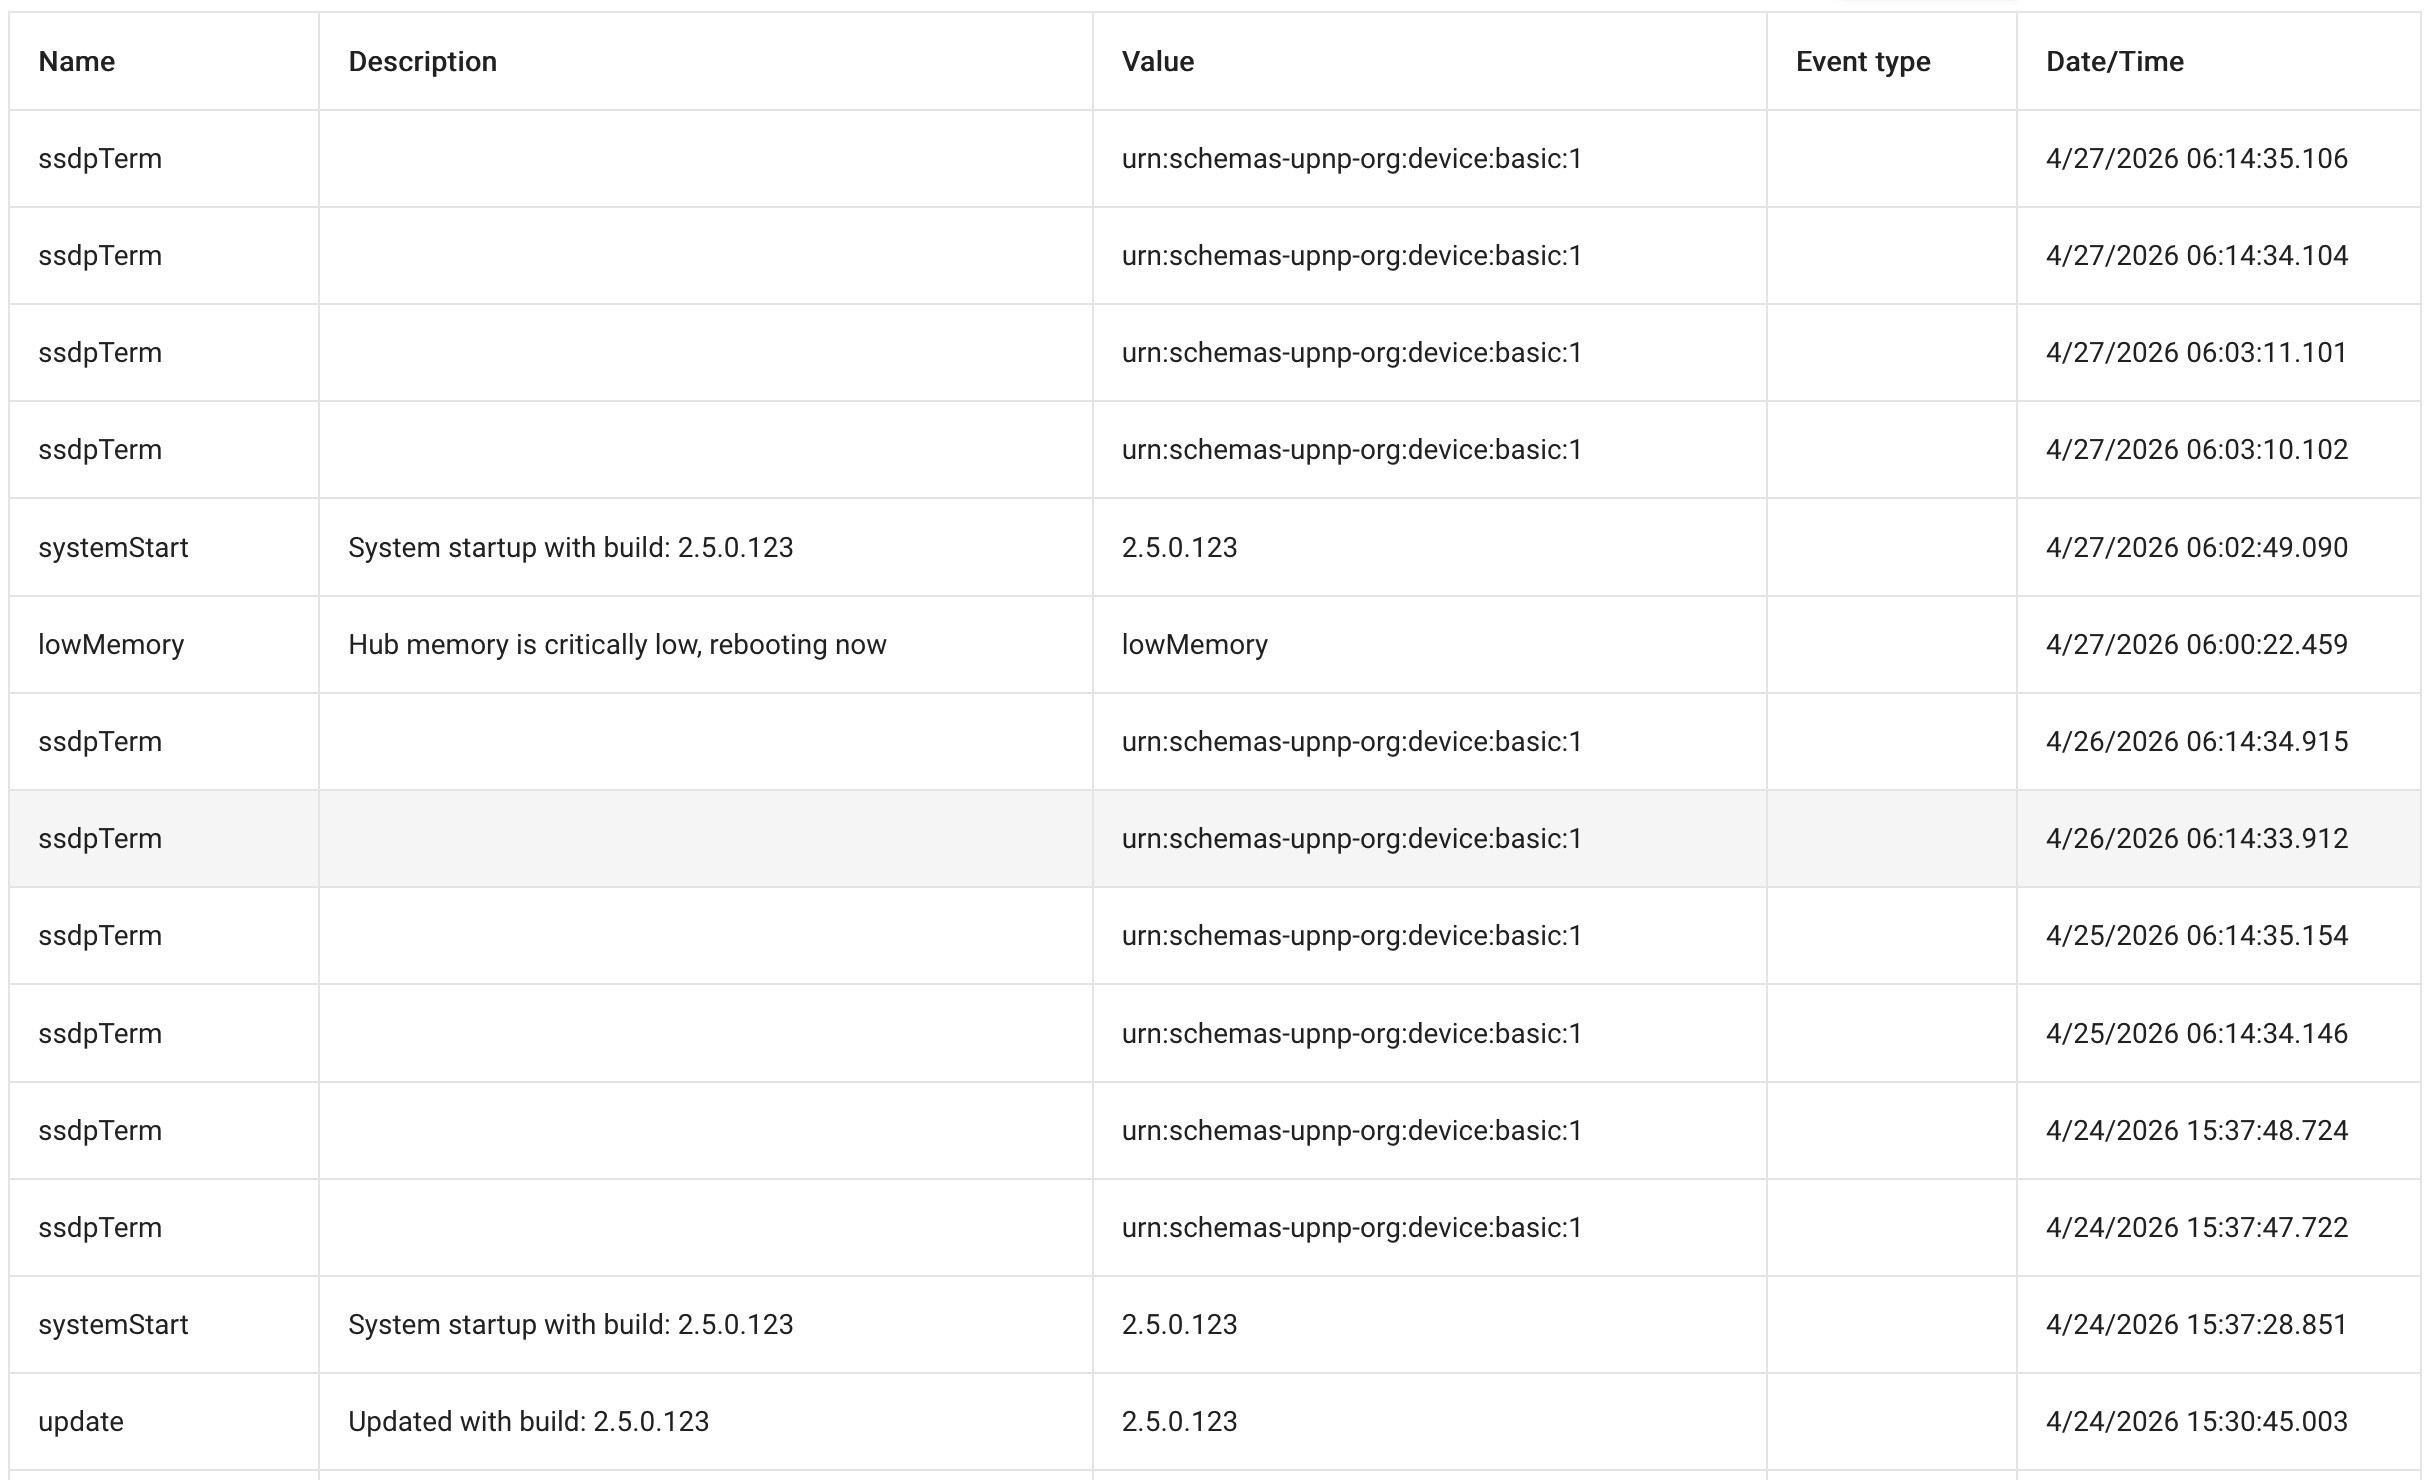
Both hubs used to do a scheduled reboot every two days during the night, but I disabled that to check whether this was an issue with my AlertMe drivers, but I really don't believe that it is now. Plus, those drivers aren't installed on the C8 Pro at all.
My C8 Pro seems to be losing more slowly with 2.5.0.123. Of course that could change at any time.
2.5.0.123 seems to have put the memory leak in my C5 into overdrive. My hub has historically lost "snappiness" when it goes below 150K so I have a rule to reboot in the early morning hours if it's under 160K. This rule runs after the nightly cleanup the hub does.
Day 1 of new firmware the 160 rule triggered that night. I do a database rebuild after every firmware update so I presumed the database was ok. I was doing some old code cleanup immediately after the update so I attributed the reboot to that. The hub always loses memory faster when I do work on it.
The 160 rule rebooted the hub again last night after only 4 days. Before the 2.5.0 update I would go a month or more before memory loss was an issue. If it even became an issue. It has been a rare occurrence. It usually settled in the 180K to 200K range and stayed there. I didn't recall ever having this degree of memory loss.
Today, I'm going to do another database rebuild and disable the rule and see if maybe the memory stabilizes at a lower level and the hub still functions ok. I realize that updates are probably consuming more memory and maybe the hub will stabilize at a lower level and still work well with all the recent updates. This rule goes back to the days when everyone had memory leak issues so a lot internally has changed since that time. The step after that is to to roll back the firmware and see if the leak persists.
Anyone with a C5 willing to chime in? I'm curious if others are seeing this huge leak and at what point do they reboot or how low does the hub go before it reboots on it's own. Just looking for some data points with other C5 users.
The reboot is only noticed if I'm awake doing a bathroom run at 3 am and the nightlights didn't come on but I want to see what's causing the leak.