I got it to work. Thank you.
I was missing the "Add Virtual Device" part.
Chris
I got it to work. Thank you.
I was missing the "Add Virtual Device" part.
Chris
I tried to come up with a solution that works without external programs (like node-red). It still needs some polish, but I think it works.
hubitatuser12/hubitatCode/blob/master/drivers/Syslog.groovy
/**
 * This program is free software: you can redistribute it and/or modify
 * it under the terms of the GNU General Public License as published by
 * the Free Software Foundation, either version 3 of the License, or
 * (at your option) any later version.
 *
 * This program is distributed in the hope that it will be useful,
 * but WITHOUT ANY WARRANTY; without even the implied warranty of
 * MERCHANTABILITY or FITNESS FOR A PARTICULAR PURPOSE.  See the
 * GNU General Public License for more details.
 *
 * You should have received a copy of the GNU General Public License
 * along with this program.  If not, see <https://www.gnu.org/licenses/>.
 */
metadata {
    definition (name: "Syslog", namespace: "hubitatuser12", author: "Hubitat User 12") {
        capability "Initialize"
    }
    command "disconnect"
Unfortunately the github said this is no longer there... anyone else got a syslog link that will work natively without external programs?
FYI - it may vary based on syslog implementation, but I found that the number of columns being sent by the Syslog driver was too few for receipt by my rsyslogd server. The log message would get logged, but the metadata about the device name and device ID that are formed by the Syslog driver would not appear in my logs. To resolve this, where there are two - in the constructedString, I just added a third - to increase the number of columns being sent, Now, the metadata with device name and device ID appear in my logs.
Thanks for this - just awesome - a couple of questions:
Could you share your node-RED code for this newbie?
Here it is:
[{"id":"3d1f1994.a4d226","type":"tab","label":"Hubitat Logs","disabled":false,"info":""},{"id":"7afc51e5.c6996","type":"websocket in","z":"3d1f1994.a4d226","name":"","server":"","client":"9367365.4710bc8","x":210,"y":200,"wires":[["e703cf77.a29a7"]]},{"id":"e703cf77.a29a7","type":"json","z":"3d1f1994.a4d226","name":"","property":"payload","action":"obj","pretty":false,"x":430,"y":200,"wires":[["9aa13982.b8b418"]]},{"id":"bb0988e7.032bf8","type":"influxdb batch","z":"3d1f1994.a4d226","influxdb":"991c0352.4c569","precision":"","retentionPolicy":"","name":"","x":980,"y":200,"wires":[]},{"id":"9aa13982.b8b418","type":"function","z":"3d1f1994.a4d226","name":"Syslog Message","func":"let time = new Date(msg.payload.time);\n\nreturn {\n payload: [{\n measurement: \"syslog\",\n fields: {\n facility_code: 1,\n message: unescapeHtml(msg.payload.msg),\n procid: msg.payload.id,\n severity_code: levelToSeverityCode(msg.payload.level),\n timestamp: time.getTime()*1000000, //convert to nanoseconds\n version: 1\n },\n tags:{\n appname: msg.payload.name,\n facility: msg.payload.type, // \"user\",\n host: \"hubitat\",\n hostname: \"hubitat\",\n severity: levelToSeverity(msg.payload.level)\n },\n timestamp: time\n }]\n};\n\n// For info on the message format: https://www.influxdata.com/blog/writing-logs-directly-to-influxdb/\n\n\nfunction unescapeHtml(unsafe) {\n if (!unsafe)\n return unsafe;\n return unsafe\n .replace(/&/g, \"&\")\n .replace(/</g, \"<\")\n .replace(/>/g, \">\")\n .replace(/"/g, \"\\\"\")\n .replace(//g, \"'\")\n .replace(/'/g, \"'\")\n .replace(/'/g, \"'\");\n}\n\n/*\n0\tEmergency\temerg\tSystem is unusable\tThis level should not be used by applications.\n1\tAlert\talert\tShould be corrected immediately\tLoss of the primary ISP connection.\n2\tCritical\tcrit\tCritical conditions\tA failure in the system's primary application.\n3\tError\terr\tError conditions\tAn application has exceeded its file storage limit and attempts to write are failing.\n4\tWarning\twarning\tMay indicate that an error will occur if action is not taken.\tA non-root file system has only 2GB remaining.\n5\tNotice\tnotice\tEvents that are unusual, but not error conditions.\t \n6\tInformational\tinfo\tNormal operational messages that require no action.\tAn application has started, paused or ended successfully.\n7\tDebug\tdebug\tInformation useful to developers for debugging the application.\t \n*/\n\nfunction levelToSeverityCode(level) {\n switch (msg.payload.level) {\n case \"error\":\n return 3;\n case \"warn\":\n return 4;\n case \"info\":\n return 6;\n default:\n return 7;\n }\n}\n\nfunction levelToSeverity(level) {\n switch (level) {\n case \"error\":\n return \"err\";\n case \"warn\":\n return \"warning\";\n case \"info\":\n return \"info\";\n default:\n return \"debug\"\n }\n}","outputs":1,"noerr":0,"x":600,"y":200,"wires":[["d2eee62c.f29988"]]},{"id":"d2eee62c.f29988","type":"batch","z":"3d1f1994.a4d226","name":"","mode":"interval","count":10,"overlap":0,"interval":10,"allowEmptySequence":false,"topics":[],"x":770,"y":200,"wires":[["bb0988e7.032bf8"]]},{"id":"9367365.4710bc8","type":"websocket-client","path":"ws://192.168.1.70/logsocket","tls":"","wholemsg":"false"},{"id":"991c0352.4c569","type":"influxdb","hostname":"192.168.1.177","port":"8086","protocol":"http","database":"hubitat","name":"","usetls":false,"tls":""}]
Can't you configure a web socket in node-RED to be JSON?
I don't know how to
It is possible to sent data directly to InfluxDB from app or driver code (e.g. as in Syslog.groovy above), but I don't see a use for that. My use case is to be able to collect Hubitat logs externally for search a review. As far as I know Hubitat does not provide a way to tap into the logging system to have a custom logger.
Thanks for this! I’ll try this out - much appreciated.
This is working really nice !
I believe folks are asking for syslog output of the existing HE Logs, not devices.
Then I'm with you on this. One of the comments above mentioned how great it would be if syslog for the he device was built in. Amen, I say. I admit my take on it was to get better power monitoring out of devices that only seemed to speak syslog. But for the pucks themselves, yes I agree.
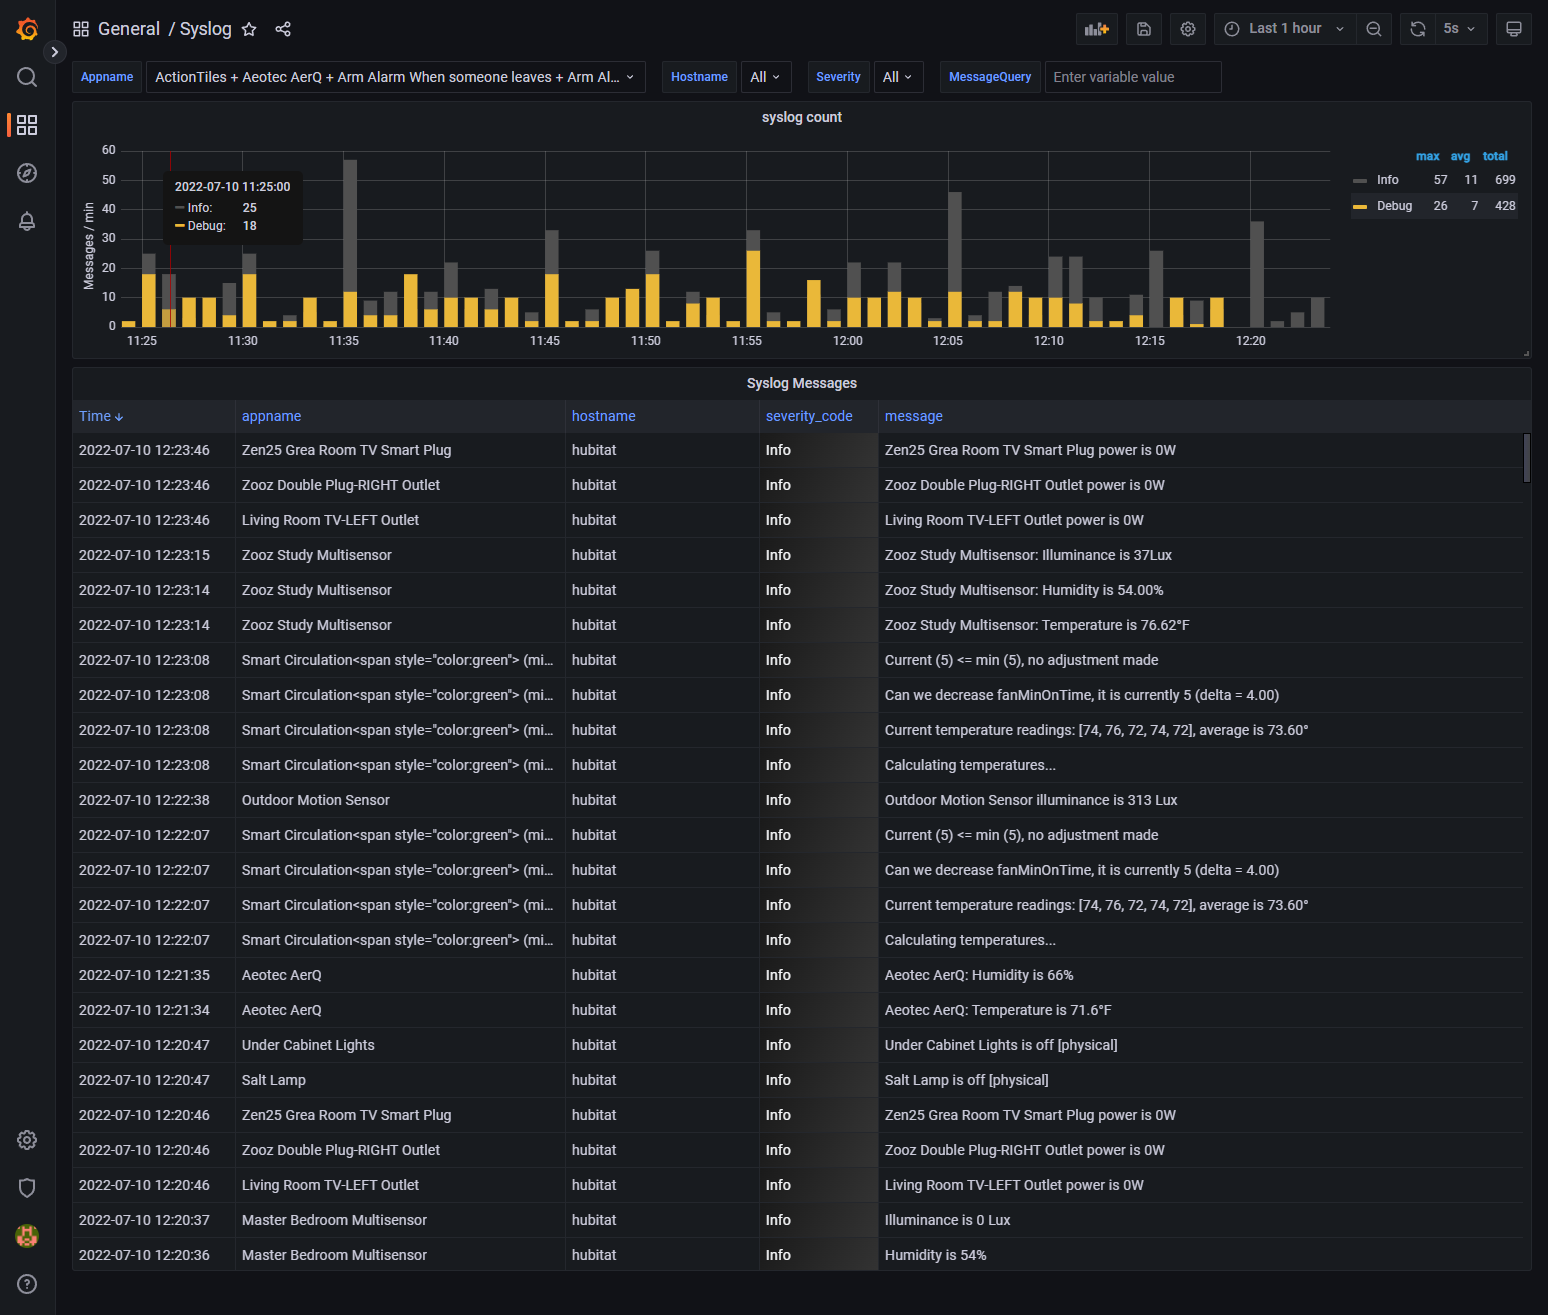
Just incase anyone else tries this I found this syslog dashboard template for Grafana
Syslog dashboard for Grafana | Grafana Labs
This can allow us to view all of the data in Grafana. Here is an example of how it looks
I did make two changes to the template though. The top graph doesn't recognize Debug as a state. That required a fairly simple update to a query to specify debug instead of a unused value for Hubitat. Then i enabled Cell Value Inspect for the bottom table. This is only needed if the messages sent to the syslog are pretty long.
very nice... i never thought about about virtualizing my syslog server with Grafana. I use it for other things but just never thought about syslog. Thanks for the idea!!
I only did it so that i could more easily track stuff down in the logs. It really works well.
I think it's an awesome idea, though i have a ton of things thrown into my syslog server, which i think this will help visualize. None the less thanks for the idea!! 
Shameless plug:
Download the Hubitat app