Live Logging to InfluxDB

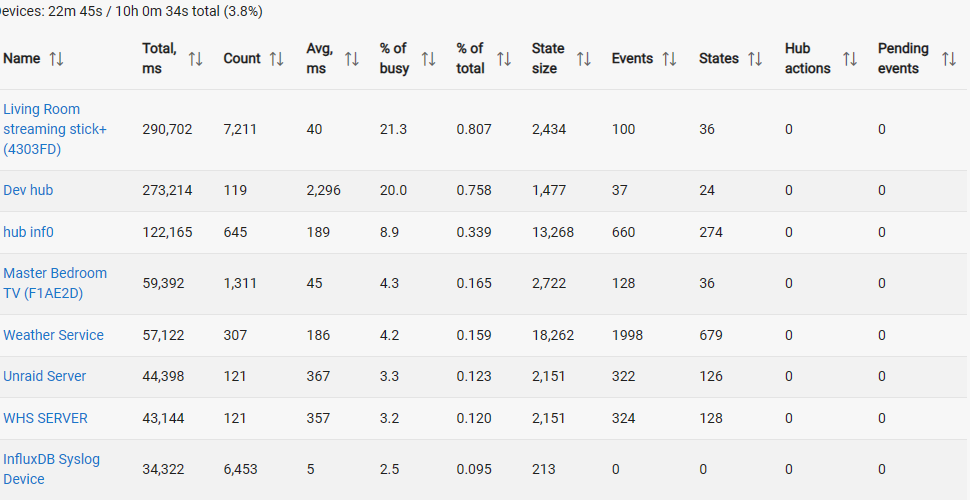
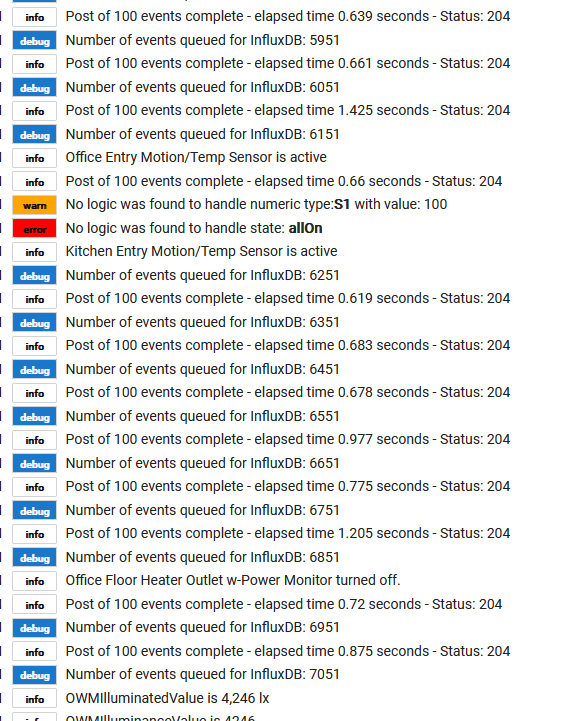
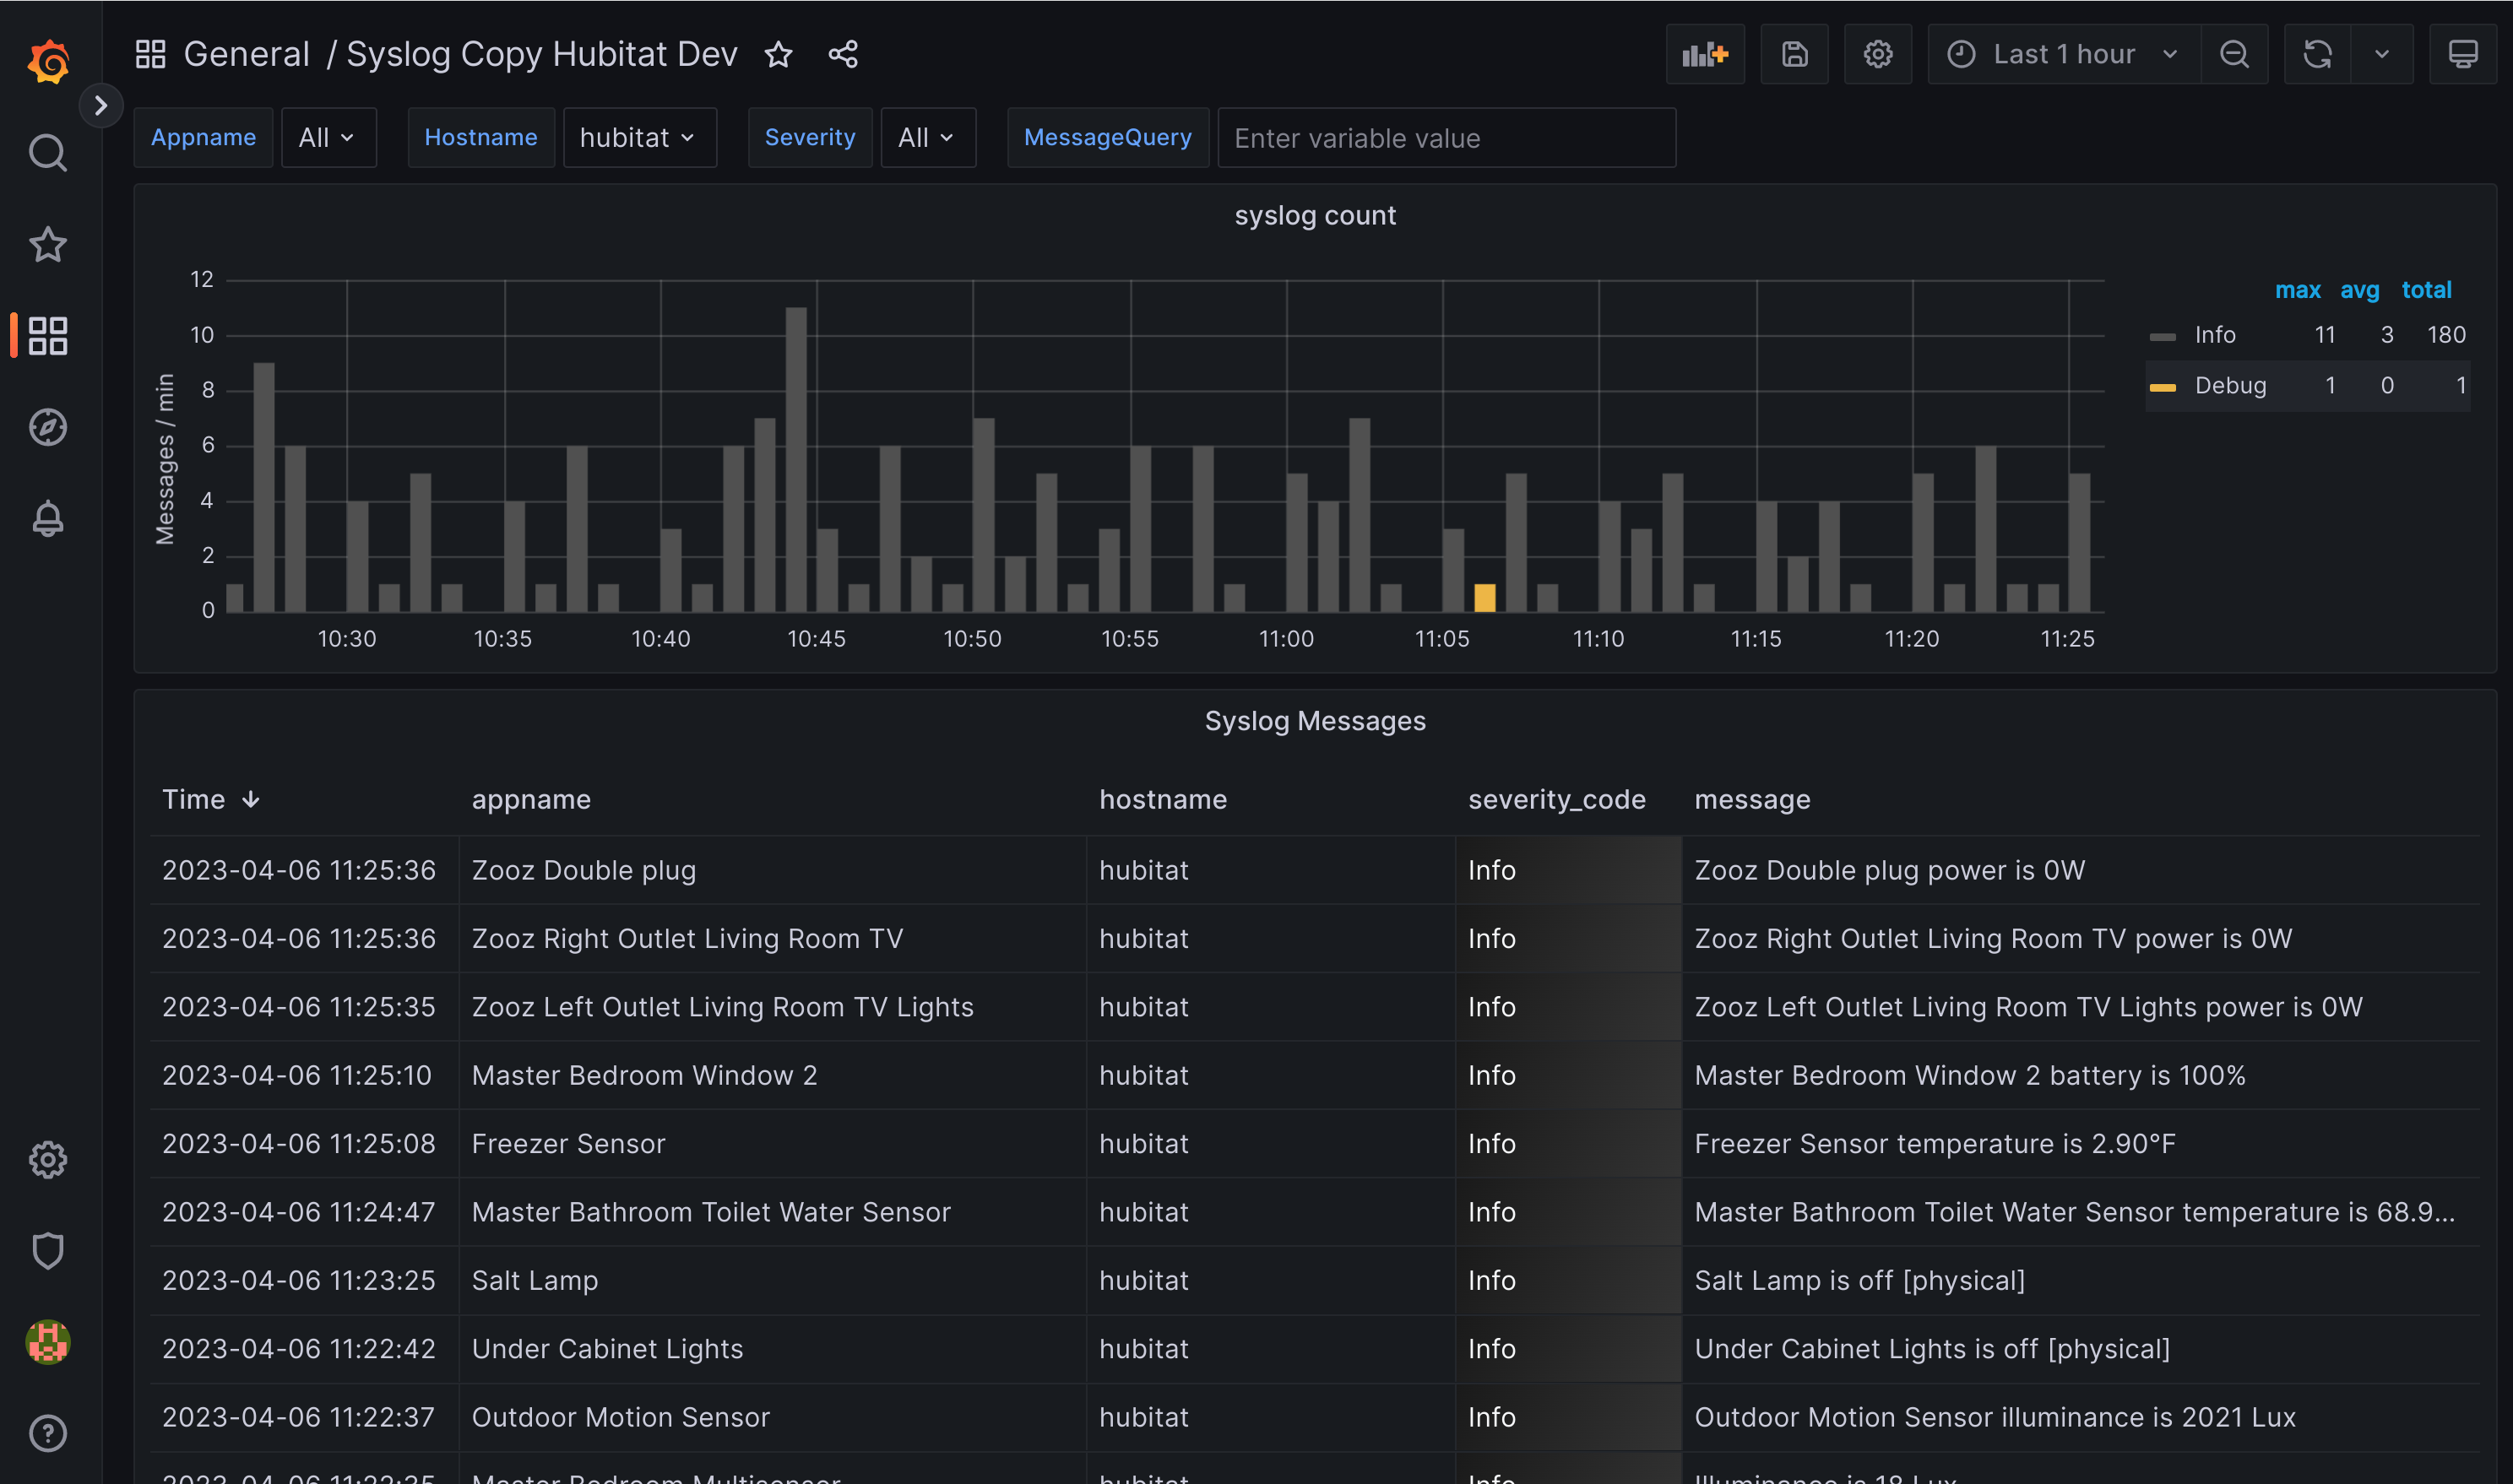
So was working on something for a few days and figured I would share it. For sometime I have been running a Live Logging collection flow through Node-Red. It basically connects to the websocket for Live Logging and then formats it and writes it to InfluxDB. The there is a Grafana dashboard that access that data and displays it in a way that is very consumable. This dashboard is shown below

A while back I saw the beginning of a driver that attempted to write live logging info out to a syslog Server. I have combined the two ideas and here are the results.

Here is a virtual driver that will connect to the local hub and output it's live logging to InfluxDB

Here is the JSON you can import to Grafana to create the dashboard.

{
  "__inputs": [
    {
      "name": "DS_INFLUXDB_HUBITAT2",
      "label": "InfluxDB Hubitat2",
      "description": "",
      "type": "datasource",
      "pluginId": "influxdb",
      "pluginName": "InfluxDB"
    }
  ],
  "__elements": {},
  "__requires": [
    {
      "type": "grafana",
      "id": "grafana",
      "name": "Grafana",
      "version": "9.4.7"
    },
    {
      "type": "panel",
      "id": "graph",
      "name": "Graph (old)",
      "version": ""
    },
    {
      "type": "datasource",
      "id": "influxdb",
      "name": "InfluxDB",
      "version": "1.0.0"
    },
    {
      "type": "panel",
      "id": "table",
      "name": "Table",
      "version": ""
    }
  ],
  "annotations": {
    "list": [
      {
        "builtIn": 1,
        "datasource": {
          "type": "datasource",
          "uid": "grafana"
        },
        "enable": true,
        "hide": true,
        "iconColor": "rgba(0, 211, 255, 1)",
        "name": "Annotations & Alerts",
        "target": {
          "limit": 100,
          "matchAny": false,
          "tags": [],
          "type": "dashboard"
        },
        "type": "dashboard"
      }
    ]
  },
  "description": "Telegraf / InfluxDB / Grafana as syslog receiver",
  "editable": true,
  "fiscalYearStartMonth": 0,
  "gnetId": 12433,
  "graphTooltip": 0,
  "id": null,
  "links": [],
  "liveNow": false,
  "panels": [
    {
      "aliasColors": {},
      "bars": true,
      "dashLength": 10,
      "dashes": false,
      "datasource": {
        "type": "influxdb",
        "uid": "${DS_INFLUXDB_HUBITAT2}"
      },
      "decimals": 0,
      "fill": 1,
      "fillGradient": 0,
      "gridPos": {
        "h": 7,
        "w": 24,
        "x": 0,
        "y": 0
      },
      "hiddenSeries": false,
      "id": 10,
      "interval": "",
      "legend": {
        "alignAsTable": true,
        "avg": true,
        "current": false,
        "max": true,
        "min": false,
        "rightSide": true,
        "show": true,
        "total": true,
        "values": true
      },
      "lines": false,
      "linewidth": 1,
      "links": [],
      "nullPointMode": "connected",
      "options": {
        "alertThreshold": true
      },
      "percentage": false,
      "pluginVersion": "9.4.7",
      "pointradius": 2,
      "points": false,
      "renderer": "flot",
      "seriesOverrides": [
        {
          "alias": "Info",
          "color": "rgb(80, 80, 80)",
          "stack": "A"
        },
        {
          "alias": "Notice",
          "color": "rgb(182, 182, 182)",
          "stack": "A"
        },
        {
          "alias": "Warning",
          "color": "#E0B400",
          "stack": "A"
        },
        {
          "alias": "Error",
          "color": "#FF780A",
          "stack": "A"
        },
        {
          "alias": "Critical",
          "color": "#E02F44",
          "stack": "A"
        },
        {
          "alias": "Alert",
          "color": "#8F3BB8",
          "stack": "A"
        },
        {
          "alias": "Emergency",
          "color": "#8F3BB8",
          "stack": "A"
        }
      ],
      "spaceLength": 10,
      "stack": false,
      "steppedLine": false,
      "targets": [
        {
          "alias": "Info",
          "datasource": {
            "type": "influxdb",
            "uid": "${DS_INFLUXDB_HUBITAT2}"
          },
          "groupBy": [
            {
              "params": [
                "1m"
              ],
              "type": "time"
            },
            {
              "params": [
                "null"
              ],
              "type": "fill"
            }
          ],
          "measurement": "syslog",
          "orderByTime": "ASC",
          "policy": "default",
          "refId": "A",
          "resultFormat": "time_series",
          "select": [
            [
              {
                "params": [
                  "severity_code"
                ],
                "type": "field"
              },
              {
                "params": [],
                "type": "count"
              }
            ]
          ],
          "tags": [
            {
              "key": "severity",
              "operator": "=",
              "value": "info"
            },
            {
              "condition": "AND",
              "key": "hostname",
              "operator": "=~",
              "value": "/^$hostname$/"
            },
            {
              "condition": "AND",
              "key": "severity",
              "operator": "=~",
              "value": "/^$severity$/"
            },
            {
              "condition": "AND",
              "key": "appname",
              "operator": "=~",
              "value": "/^$appname$/"
            },
            {
              "condition": "AND",
              "key": "message",
              "operator": "=~",
              "value": "/$Query/"
            }
          ]
        },
        {
          "alias": "Notice",
          "datasource": {
            "type": "influxdb",
            "uid": "${DS_INFLUXDB_HUBITAT2}"
          },
          "groupBy": [
            {
              "params": [
                "1m"
              ],
              "type": "time"
            },
            {
              "params": [
                "null"
              ],
              "type": "fill"
            }
          ],
          "measurement": "syslog",
          "orderByTime": "ASC",
          "policy": "default",
          "refId": "B",
          "resultFormat": "time_series",
          "select": [
            [
              {
                "params": [
                  "severity_code"
                ],
                "type": "field"
              },
              {
                "params": [],
                "type": "count"
              }
            ]
          ],
          "tags": [
            {
              "key": "severity",
              "operator": "=",
              "value": "notice"
            },
            {
              "condition": "AND",
              "key": "hostname",
              "operator": "=~",
              "value": "/^$hostname$/"
            },
            {
              "condition": "AND",
              "key": "severity",
              "operator": "=~",
              "value": "/^$severity$/"
            },
            {
              "condition": "AND",
              "key": "appname",
              "operator": "=~",
              "value": "/^$appname$/"
            },
            {
              "condition": "AND",
              "key": "message",
              "operator": "=~",
              "value": "/$Query/"
            }
          ]
        },
        {
          "alias": "Warning",
          "datasource": {
            "type": "influxdb",
            "uid": "${DS_INFLUXDB_HUBITAT2}"
          },
          "groupBy": [
            {
              "params": [
                "1m"
              ],
              "type": "time"
            },
            {
              "params": [
                "null"
              ],
              "type": "fill"
            }
          ],
          "measurement": "syslog",
          "orderByTime": "ASC",
          "policy": "default",
          "refId": "D",
          "resultFormat": "time_series",
          "select": [
            [
              {
                "params": [
                  "severity_code"
                ],
                "type": "field"
              },
              {
                "params": [],
                "type": "count"
              }
            ]
          ],
          "tags": [
            {
              "key": "severity",
              "operator": "=",
              "value": "warning"
            },
            {
              "condition": "AND",
              "key": "hostname",
              "operator": "=~",
              "value": "/^$hostname$/"
            },
            {
              "condition": "AND",
              "key": "severity",
              "operator": "=~",
              "value": "/^$severity$/"
            },
            {
              "condition": "AND",
              "key": "appname",
              "operator": "=~",
              "value": "/^$appname$/"
            },
            {
              "condition": "AND",
              "key": "message",
              "operator": "=~",
              "value": "/$Query/"
            }
          ]
        },
        {
          "alias": "Error",
          "datasource": {
            "type": "influxdb",
            "uid": "${DS_INFLUXDB_HUBITAT2}"
          },
          "groupBy": [
            {
              "params": [
                "1m"
              ],
              "type": "time"
            },
            {
              "params": [
                "null"
              ],
              "type": "fill"
            }
          ],
          "measurement": "syslog",
          "orderByTime": "ASC",
          "policy": "default",
          "refId": "C",
          "resultFormat": "time_series",
          "select": [
            [
              {
                "params": [
                  "severity_code"
                ],
                "type": "field"
              },
              {
                "params": [],
                "type": "count"
              }
            ]
          ],
          "tags": [
            {
              "key": "severity",
              "operator": "=",
              "value": "err"
            },
            {
              "condition": "AND",
              "key": "hostname",
              "operator": "=~",
              "value": "/^$hostname$/"
            },
            {
              "condition": "AND",
              "key": "severity",
              "operator": "=~",
              "value": "/^$severity$/"
            },
            {
              "condition": "AND",
              "key": "appname",
              "operator": "=~",
              "value": "/^$appname$/"
            },
            {
              "condition": "AND",
              "key": "message",
              "operator": "=~",
              "value": "/$Query/"
            }
          ]
        },
        {
          "alias": "Critical",
          "datasource": {
            "type": "influxdb",
            "uid": "${DS_INFLUXDB_HUBITAT2}"
          },
          "groupBy": [
            {
              "params": [
                "1m"
              ],
              "type": "time"
            },
            {
              "params": [
                "null"
              ],
              "type": "fill"
            }
          ],
          "measurement": "syslog",
          "orderByTime": "ASC",
          "policy": "default",
          "refId": "E",
          "resultFormat": "time_series",
          "select": [
            [
              {
                "params": [
                  "severity_code"
                ],
                "type": "field"
              },
              {
                "params": [],
                "type": "count"
              }
            ]
          ],
          "tags": [
            {
              "key": "severity",
              "operator": "=",
              "value": "crit"
            },
            {
              "condition": "AND",
              "key": "hostname",
              "operator": "=~",
              "value": "/^$hostname$/"
            },
            {
              "condition": "AND",
              "key": "severity",
              "operator": "=~",
              "value": "/^$severity$/"
            },
            {
              "condition": "AND",
              "key": "appname",
              "operator": "=~",
              "value": "/^$appname$/"
            },
            {
              "condition": "AND",
              "key": "message",
              "operator": "=~",
              "value": "/$Query/"
            }
          ]
        },
        {
          "alias": "Alert",
          "datasource": {
            "type": "influxdb",
            "uid": "${DS_INFLUXDB_HUBITAT2}"
          },
          "groupBy": [
            {
              "params": [
                "1m"
              ],
              "type": "time"
            },
            {
              "params": [
                "null"
              ],
              "type": "fill"
            }
          ],
          "measurement": "syslog",
          "orderByTime": "ASC",
          "policy": "default",
          "refId": "F",
          "resultFormat": "time_series",
          "select": [
            [
              {
                "params": [
                  "severity_code"
                ],
                "type": "field"
              },
              {
                "params": [],
                "type": "count"
              }
            ]
          ],
          "tags": [
            {
              "key": "severity",
              "operator": "=",
              "value": "alert"
            },
            {
              "condition": "AND",
              "key": "hostname",
              "operator": "=~",
              "value": "/^$hostname$/"
            },
            {
              "condition": "AND",
              "key": "severity",
              "operator": "=~",
              "value": "/^$severity$/"
            },
            {
              "condition": "AND",
              "key": "appname",
              "operator": "=~",
              "value": "/^$appname$/"
            },
            {
              "condition": "AND",
              "key": "message",
              "operator": "=~",
              "value": "/$Query/"
            }
          ]
        },
        {
          "alias": "Debug",
          "datasource": {
            "type": "influxdb",
            "uid": "${DS_INFLUXDB_HUBITAT2}"
          },
          "groupBy": [
            {
              "params": [
                "1m"
              ],
              "type": "time"
            },
            {
              "params": [
                "null"
              ],
              "type": "fill"
            }
          ],
          "measurement": "syslog",
          "orderByTime": "ASC",
          "policy": "default",
          "refId": "G",
          "resultFormat": "time_series",
          "select": [
            [
              {
                "params": [
                  "severity_code"
                ],
                "type": "field"
              },
              {
                "params": [],
                "type": "count"
              }
            ]
          ],
          "tags": [
            {
              "key": "severity",
              "operator": "=",
              "value": "debug"
            },
            {
              "condition": "AND",
              "key": "hostname",
              "operator": "=~",
              "value": "/^$hostname$/"
            },
            {
              "condition": "AND",
              "key": "severity",
              "operator": "=~",
              "value": "/^$severity$/"
            },
            {
              "condition": "AND",
              "key": "appname",
              "operator": "=~",
              "value": "/^$appname$/"
            },
            {
              "condition": "AND",
              "key": "message",
              "operator": "=~",
              "value": "/$Query/"
            }
          ]
        }
      ],
      "thresholds": [],
      "timeRegions": [],
      "title": "syslog count",
      "tooltip": {
        "shared": true,
        "sort": 0,
        "value_type": "individual"
      },
      "type": "graph",
      "xaxis": {
        "mode": "time",
        "show": true,
        "values": []
      },
      "yaxes": [
        {
          "decimals": 0,
          "format": "none",
          "label": "Messages / min",
          "logBase": 1,
          "show": true
        },
        {
          "format": "short",
          "logBase": 1,
          "show": false
        }
      ],
      "yaxis": {
        "align": false
      }
    },
    {
      "datasource": {
        "type": "influxdb",
        "uid": "${DS_INFLUXDB_HUBITAT2}"
      },
      "description": "",
      "fieldConfig": {
        "defaults": {
          "color": {
            "mode": "thresholds"
          },
          "custom": {
            "align": "left",
            "cellOptions": {
              "type": "auto"
            },
            "filterable": false,
            "inspect": true
          },
          "mappings": [],
          "thresholds": {
            "mode": "absolute",
            "steps": [
              {
                "color": "dark-purple",
                "value": null
              },
              {
                "color": "dark-red",
                "value": 2
              },
              {
                "color": "dark-orange",
                "value": 3
              },
              {
                "color": "dark-yellow",
                "value": 4
              },
              {
                "color": "rgb(150, 150, 150)",
                "value": 5
              },
              {
                "color": "rgb(51, 51, 51)",
                "value": 6
              },
              {
                "color": "rgb(5, 5, 5)",
                "value": 7
              }
            ]
          }
        },
        "overrides": [
          {
            "matcher": {
              "id": "byName",
              "options": "severity_code"
            },
            "properties": [
              {
                "id": "mappings",
                "value": [
                  {
                    "options": {
                      "0": {
                        "text": "Emergency"
                      },
                      "1": {
                        "text": "Alert"
                      },
                      "2": {
                        "text": "Critical"
                      },
                      "3": {
                        "text": "Error"
                      },
                      "4": {
                        "text": "Warning"
                      },
                      "5": {
                        "text": "Notice"
                      },
                      "6": {
                        "text": "Info"
                      },
                      "7": {
                        "text": "Debug"
                      }
                    },
                    "type": "value"
                  }
                ]
              },
              {
                "id": "custom.cellOptions",
                "value": {
                  "mode": "gradient",
                  "type": "color-background"
                }
              },
              {
                "id": "custom.width",
                "value": 119
              }
            ]
          },
          {
            "matcher": {
              "id": "byName",
              "options": "Time"
            },
            "properties": [
              {
                "id": "custom.width",
                "value": 163
              }
            ]
          },
          {
            "matcher": {
              "id": "byName",
              "options": "hostname"
            },
            "properties": [
              {
                "id": "custom.width",
                "value": 194
              }
            ]
          },
          {
            "matcher": {
              "id": "byName",
              "options": "appname"
            },
            "properties": [
              {
                "id": "custom.width",
                "value": 330
              }
            ]
          }
        ]
      },
      "gridPos": {
        "h": 24,
        "w": 24,
        "x": 0,
        "y": 7
      },
      "id": 12,
      "options": {
        "footer": {
          "countRows": false,
          "fields": "",
          "reducer": [
            "sum"
          ],
          "show": false
        },
        "showHeader": true,
        "sortBy": [
          {
            "desc": true,
            "displayName": "Time"
          }
        ]
      },
      "pluginVersion": "9.4.7",
      "targets": [
        {
          "datasource": {
            "type": "influxdb",
            "uid": "${DS_INFLUXDB_HUBITAT2}"
          },
          "groupBy": [
            {
              "params": [
                "hostname"
              ],
              "type": "tag"
            },
            {
              "params": [
                "appname"
              ],
              "type": "tag"
            }
          ],
          "measurement": "syslog",
          "orderByTime": "ASC",
          "policy": "default",
          "refId": "A",
          "resultFormat": "table",
          "select": [
            [
              {
                "params": [
                  "severity_code"
                ],
                "type": "field"
              }
            ],
            [
              {
                "params": [
                  "message"
                ],
                "type": "field"
              }
            ]
          ],
          "tags": [
            {
              "key": "hostname",
              "operator": "=~",
              "value": "/^$hostname$/"
            },
            {
              "condition": "AND",
              "key": "appname",
              "operator": "=~",
              "value": "/^$appname$/"
            },
            {
              "condition": "AND",
              "key": "severity",
              "operator": "=~",
              "value": "/^$severity$/"
            },
            {
              "condition": "AND",
              "key": "message",
              "operator": "=~",
              "value": "/$Query/"
            }
          ]
        }
      ],
      "title": "Syslog Messages",
      "type": "table"
    }
  ],
  "refresh": "",
  "revision": 1,
  "schemaVersion": 38,
  "style": "dark",
  "tags": [],
  "templating": {
    "list": [
      {
        "allValue": "",
        "current": {},
        "datasource": {
          "type": "influxdb",
          "uid": "${DS_INFLUXDB_HUBITAT2}"
        },
        "definition": "SHOW TAG VALUES FROM syslog WITH KEY=appname",
        "hide": 0,
        "includeAll": true,
        "label": "Appname",
        "multi": true,
        "name": "appname",
        "options": [],
        "query": "SHOW TAG VALUES FROM syslog WITH KEY=appname",
        "refresh": 2,
        "regex": "",
        "skipUrlSync": false,
        "sort": 1,
        "tagValuesQuery": "",
        "tagsQuery": "",
        "type": "query",
        "useTags": false
      },
      {
        "allValue": "",
        "current": {},
        "datasource": {
          "type": "influxdb",
          "uid": "${DS_INFLUXDB_HUBITAT2}"
        },
        "definition": "SHOW TAG VALUES FROM syslog WITH KEY=hostname",
        "hide": 0,
        "includeAll": true,
        "label": "Hostname",
        "multi": true,
        "name": "hostname",
        "options": [],
        "query": "SHOW TAG VALUES FROM syslog WITH KEY=hostname",
        "refresh": 2,
        "regex": "",
        "skipUrlSync": false,
        "sort": 1,
        "tagValuesQuery": "",
        "tagsQuery": "",
        "type": "query",
        "useTags": false
      },
      {
        "allValue": "",
        "current": {},
        "datasource": {
          "type": "influxdb",
          "uid": "${DS_INFLUXDB_HUBITAT2}"
        },
        "definition": "SHOW TAG VALUES FROM syslog WITH KEY=severity",
        "hide": 0,
        "includeAll": true,
        "label": "Severity",
        "multi": true,
        "name": "severity",
        "options": [],
        "query": "SHOW TAG VALUES FROM syslog WITH KEY=severity",
        "refresh": 2,
        "regex": "",
        "skipUrlSync": false,
        "sort": 0,
        "tagValuesQuery": "",
        "tagsQuery": "",
        "type": "query",
        "useTags": false
      },
      {
        "current": {
          "selected": false,
          "text": "",
          "value": ""
        },
        "description": "Querystring",
        "hide": 0,
        "label": "MessageQuery",
        "name": "Query",
        "options": [
          {
            "selected": true,
            "text": "",
            "value": ""
          }
        ],
        "query": "",
        "skipUrlSync": false,
        "type": "textbox"
      }
    ]
  },
  "time": {
    "from": "now-1h",
    "to": "now"
  },
  "timepicker": {
    "refresh_intervals": [
      "5s",
      " 10s",
      " 30s",
      " 1m",
      " 5m"
    ],
    "time_options": [
      "5m",
      "15m",
      "1h",
      "6h",
      "12h",
      "24h",
      "2d",
      "7d",
      "30d"
    ]
  },
  "timezone": "",
  "title": "Syslog Copy Hubitat Dev",
  "uid": "sa3XsKL4k",
  "version": 6,
  "weekStart": ""
}

This driver combined with this dashboard for Grafana will give you what you see above. You do need to have a working InfluxDB v2 instance, and use a Auth Token for access. I don't have a 1.8 version of InfluxDB anymore. The Grafana dashboard will need to be updated to point to the correct DB once installed as well. If someone wants to actively test a Influx 1.x version I can make the appropriate changes for someone to validate. Just let me know.

5 Likes

What sort of impact does this have on the hub hooking into the logs like this? Have you seen any side effects? Seems like it might cause a bunch of extra processing.

I was very concerned about this to, but because the activity all happens in one method I feel pretty confident in the device stats I got during testing. It showed the cpu was pretty low for a device that talks across the lan. The bottom device is this InfluxDB Syslog virtual device writing data to my local InfluxDB instance. So using .09% of cpu isn't bad. And this when the hub hasn't even been running for 24 hours so it should continue to go down some. It isn't a cpu friendly as say a Zwave or Zigbee device, but it certainly could be allot worse.

What I can't be certain of is the impact if you are generating 10s of db logs per second. I don't think I generally do that as i have a fair amount of debug logging turned off.

I've set up InfluxDB and the virtual device, but it doesn't seem to be working.
Could you give me some pointers on how to find the issue?
I can reach InfluxDB on port 8086 from the browser and do things.
Windows firewall is open for TCP and UDP 8086
(First time using InfluxDB so maybe something there to check...)

This is designed to work with Influxdb 2.x. Make sure you generate a token that has full access to the DB you want to write to and populate the configuration values based on your install there really isn't much to it.

Are you getting any errors?

It was a network issue.
Once I have set "Enable debug logging" to true for the InfluxDB Logger device then I could see that it was a connection issue.

For the record I've installed InfluxDB on a VM and set port forwarding through VirtualBox, but apparently something was missing. Once I've put InfluxDB on the host machine the connection worked fine.

1 Like

FYI. !!!

It was found today with 2.3.7.138 that the InfluxDB Live Logging driver here may have issues in very busy environments. When the level of activity into the live logging grows to a certain point the driver will start to trigger alerts "Device ### has ### pending asynchronous HTTP requests"

This shouldn't cause any issues other then delaying the logging getting to the external database. i will see if i can provide a method of queueing the calls to prevent this from happening. If the number starts to climb though you may want to disable the device until i can release a update

1 Like

I just posted a update to this driver to allow it to Queue the records to post to the DB. This will prevent the issue in the previous post. If you update the driver please go into the device and click on save and then click the initialize button. to make sure any new preferences values are set for Queue size, Time between post attempts, and Max Backlog.