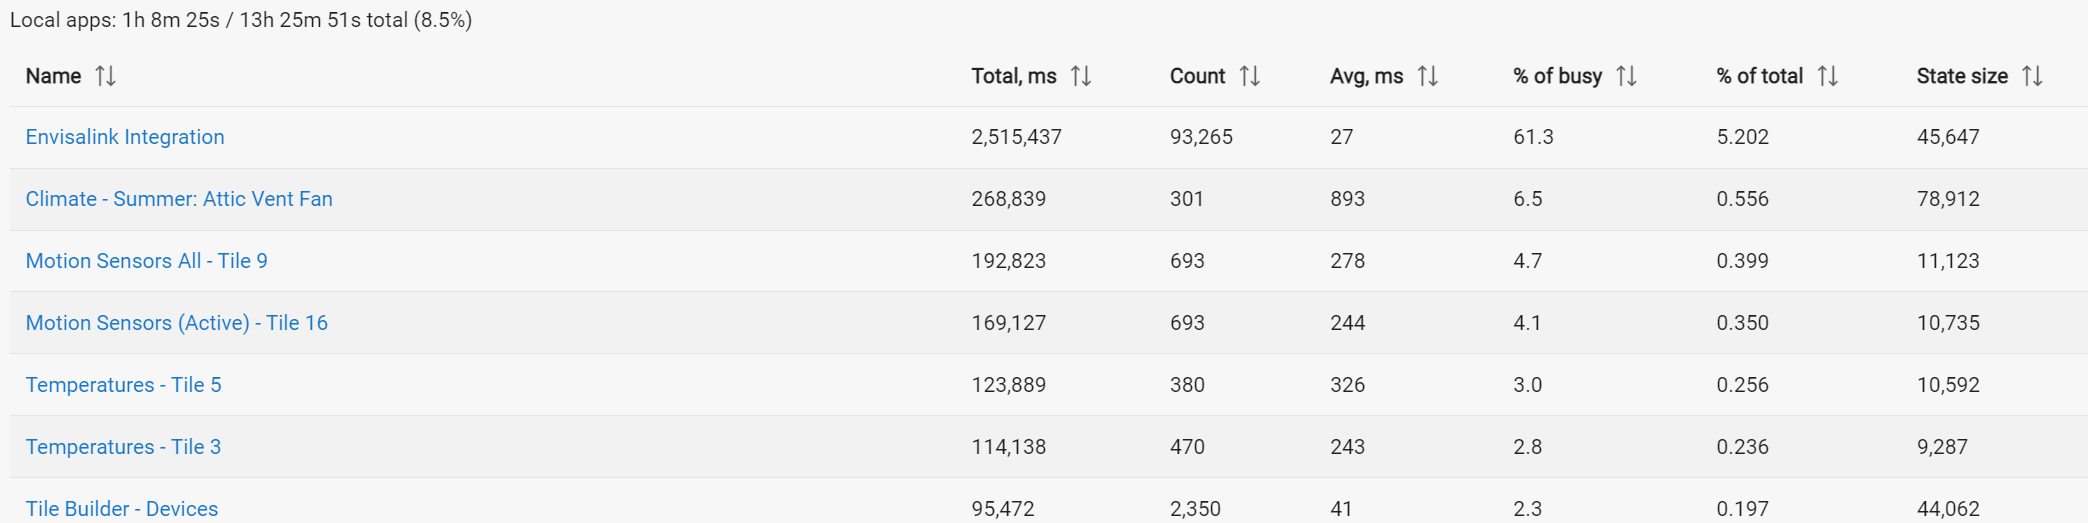
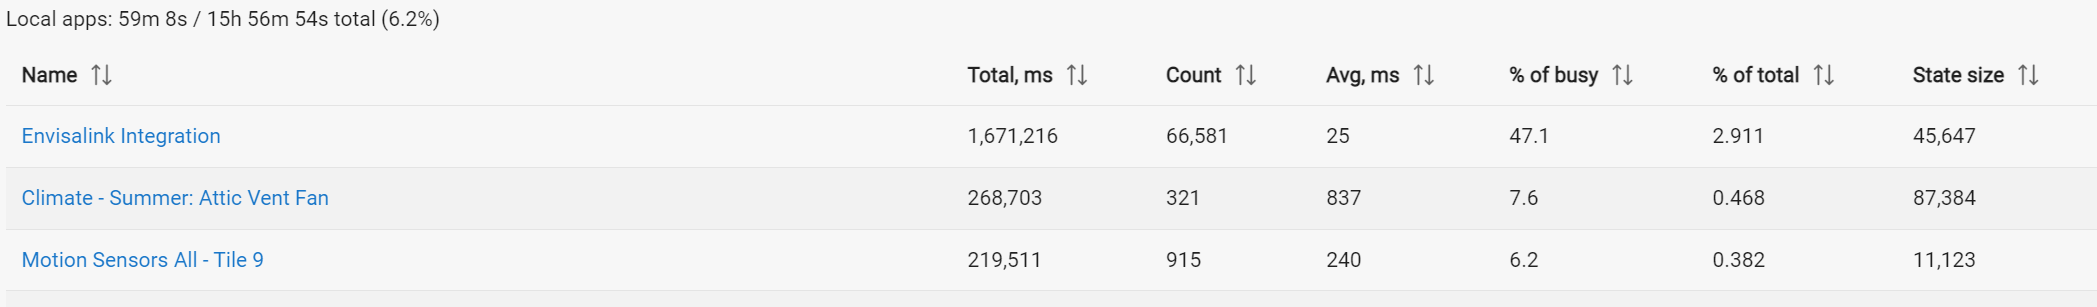
Mine is at 3.5% of total. A bit high, but I have about 20 devices on it and of course the nature of the constant streaming of info (whether anything happens or not) from the Envisalink board explains why it has to be this way.
That's the benefit of Multiple Hubs when it gets to that point... 3.5% isn't enough, but add enough of those events, eventually intervals like that converge and Z-Stuff gets impacted. You've got far to go based on what I see, but maybe the next reader of this topic will be more congested.
I actually have 2 hubs and for a while I had the envisalink on one with a few other things but I didn’t love the hub mesh and I was using Sharptools at the time for some extra configuration headaches.
Envisalink is very chatty. It's always my #2 app for resources.
I just checked and now that I'm on a C8 it's way down on the list for Apps/Devs using almost nothing, don't get why the C8 would change that.
My biggest offender now is Chromecast Helper chewing the cycles.
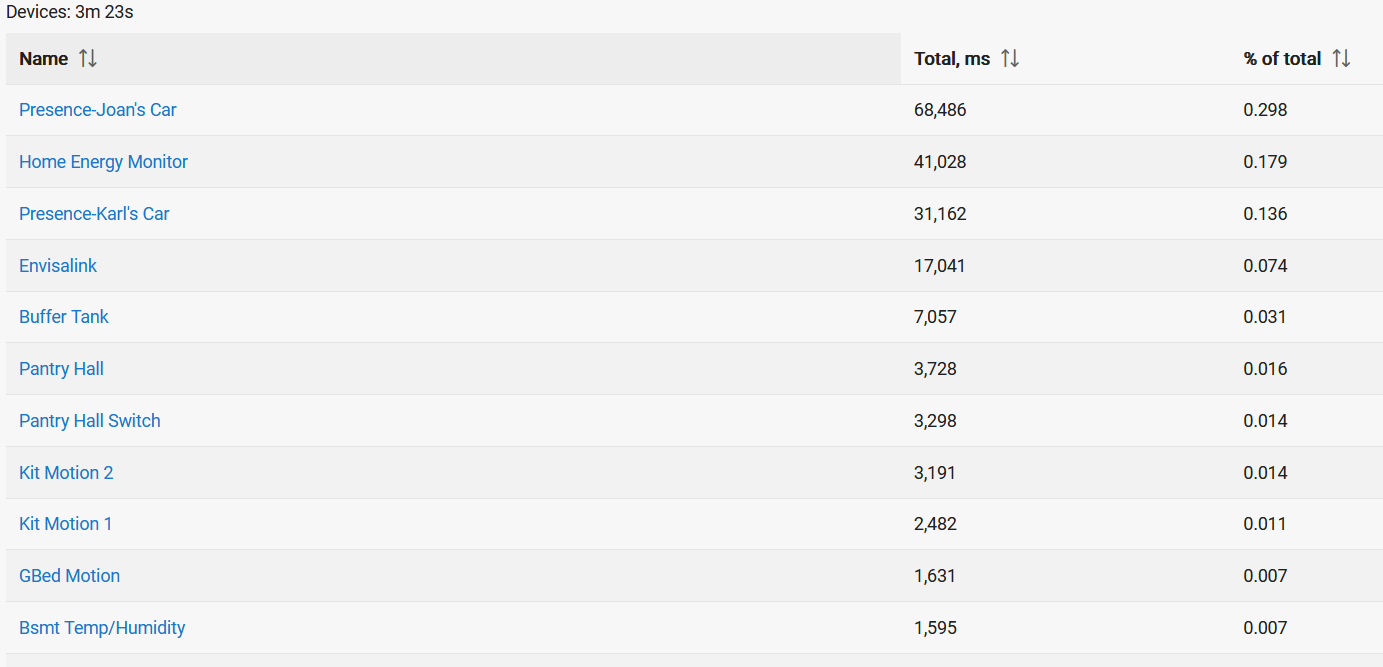
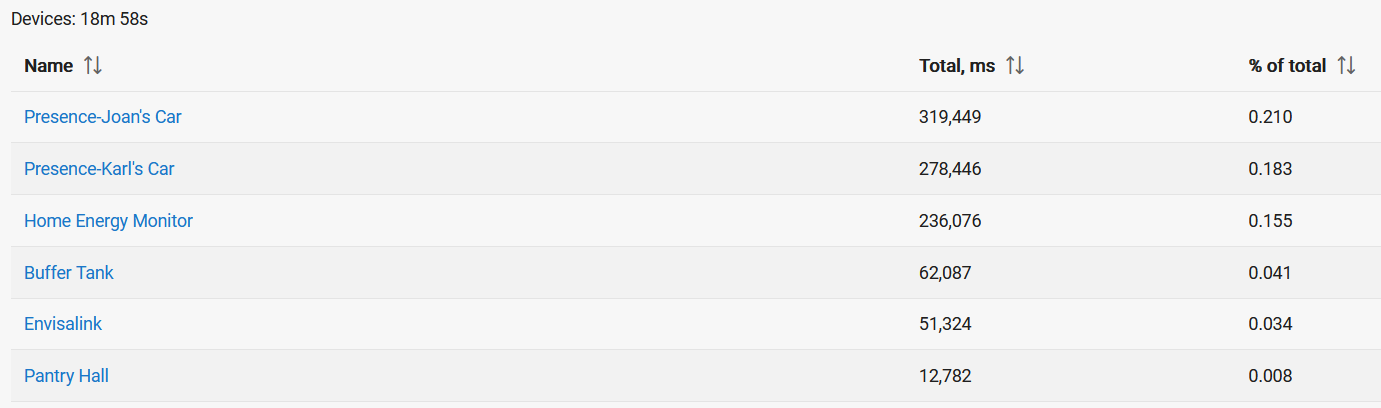
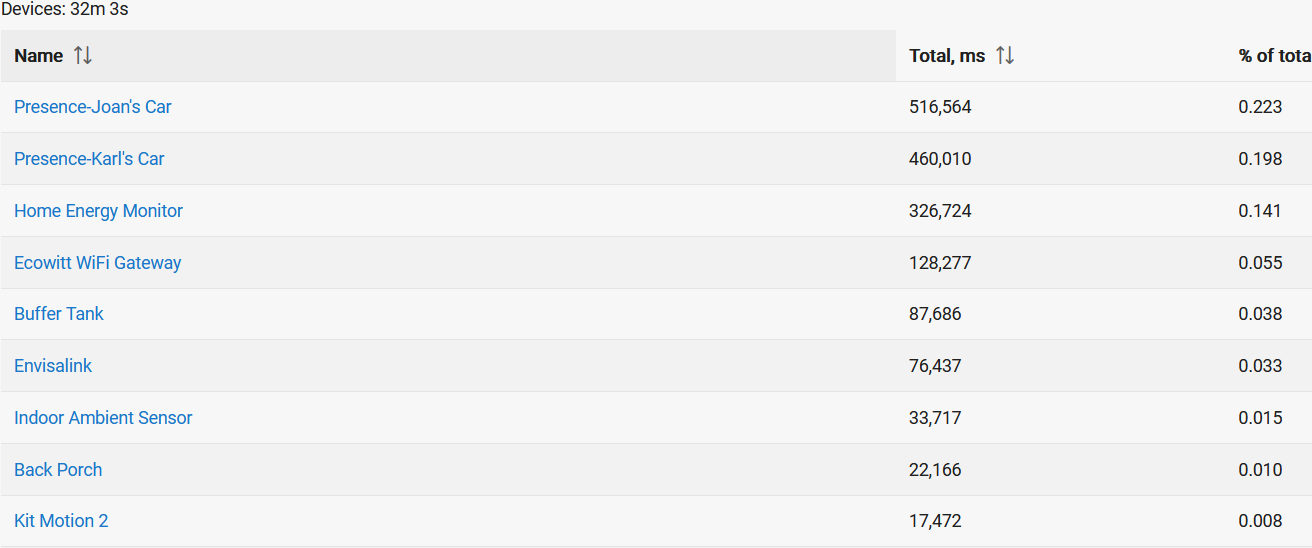
I'm surprised that the Fibaro Smart Implant (Buffer Tank) is up so high on the list. There are only 3 temperature probes, and it's not reporting that often.
I'm not aware of any software settings that could really cause my experience to be different from others, except perhaps polling which I have disabled. I have about 20 contacts and 2 smoke detectors and very little daily activity.
This caused me to take a quick look at the code. I'm not intimately familiar with it but seems that every incoming message is processed fully by parse(), however most of the time the new message is exactly the same as the prior one (because nothing has happened).
Perhaps I'm missing something but if the new message is exactly the same as the old message (probably 99% of the time in my case) then we should only need to process the message 1% of the time.
So I added this at the top of parse routine and I'm testing it out today.
def parse(String message) {
    ifDebug("Parsing Incoming message: [" + message + "]\n\n")
    state.lastMessage = state.thisMessage
    state.thisMessage = message
    //Check to see if the message has changed from the last one we received.
    //If it has not changed since the last message then we can just return as there is nothing new.
    if (message.toString() == state.lastMessage.toString()) {
        ifDebug("parse(): No change in Alarm state. Exiting.")
        return
    }
Looks good. If all goes well I'll patch my code to reduce the chatter.
I found and delete one msg a few years ago but I couldn't find this one.
Maybe while your'e in there you could silence this annoying info entrie in the logs? dev:1522023-04-28 05:18:51.996warntelnet input stream closed
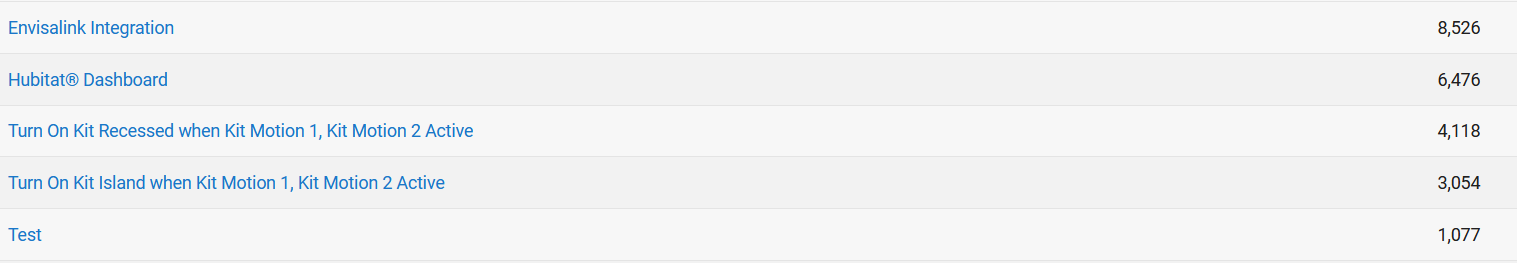
 Because the busiest App is 7/10 of a percent of the total capacity.