I don’t see why it would fail. The V3 server purports to support both the V1 and V2 write protocols (just as the V2 server did), and the V3 write protocol is a superset of the V2 protocol.
1 Like
I'm up and running on v3 CORE it seems. The only oddity was in the connection configuration, having to select
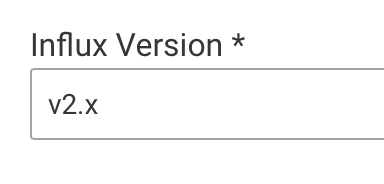
when in reality it's v3.x
I'll let you know if it hits any snags as things progress.
1 Like
I’m happy to report that I haven't had any problems at all using v3 Core with SQL queries!
Question though. What have you found to be best in terms of retention period for storage in influxDB? Do you set up different databases (with different influxDB Logger instances) for different types of data that have different retention durations?
This is a personal choice, with the number of "best" answers relating to the number of people who read your question. ![]()
I personally run a number of Influx databases, divided on data source type: Hubitat, latency monitoring, ntp timing, weather, Home Assistant, etc. All my Hubitat information, 4 hubs worth, is a single data source type and goes into one database.
I do run multiple InfluxDB Logger instances per hub, which is required because the instances have different device selection methodologies and keep-alive configurations.
Retention? I keep everything forever. ![]()
YMMV
2 Likes
everything has been working quite well with influxDB. Except I've run into one issue where Grafana includes quotations around one table's name, and it throws an error for that one table.
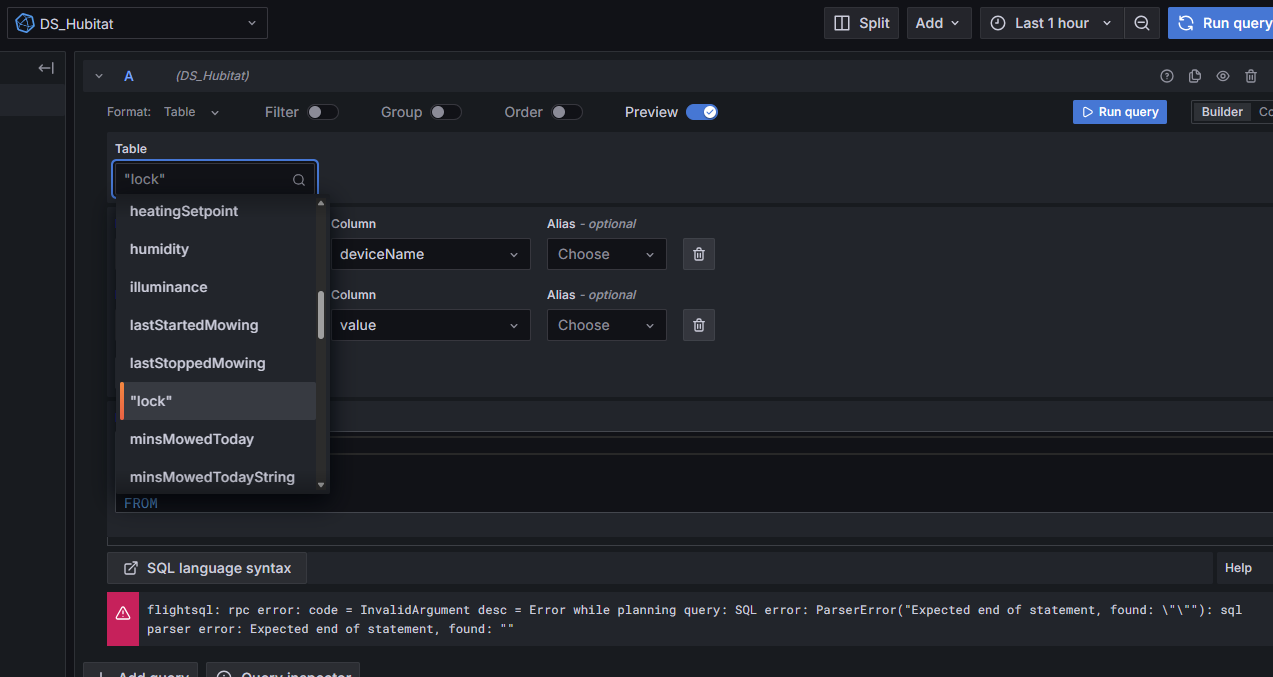
The "lock" table is the only one that has quotations around it. Any idea why that one table would be like that? Does it have anything to do with InfluxDB?
I suspect that there is a device driver in your system that is incorrectly producing events with an event name (evt.name) of
"lock"
rather than the expected
lock
Look at the deviceName field to see what device is producing it.
The queries into that 'lock' table fail though so how am i supposed to do that? Also, wouldn't that mean that there should be a normal lock table (without quotes) produced by other devices that work correctly?
Looking at the lock devices in HE, I don't see any of them that are producing a "lock" event...but not sure if HE would somehow sanitize the event name to remove quotes..
Look at the data itself. I would suggest using the InfluxDB command line rather than Grafana.
There is no way for me to answer that. I don't know how many lock-ish devices you have, if they produce lock events, or if you have them selected for InfluxDB-Logger. For that matter, I don't even know if the "lock" data is originating from InfluxDB-Logger or if there is some other entity inserting data in that database.
As an aside, from your screenshot, I see "lastStartedMowing", "lastStoppedMowing", "minsMowedToday", "minsMowedTodayString". This suggests (to me) that you may be dumping all your HE device events into InfluxDB. If you are, I would strongly recommend taking a step back and focusing on what you actually need -- I.E. data you may actually take action on. At a bare minimum, having both a numeric and a string representation for the same value certainly seems to be unnecessary.
1 Like
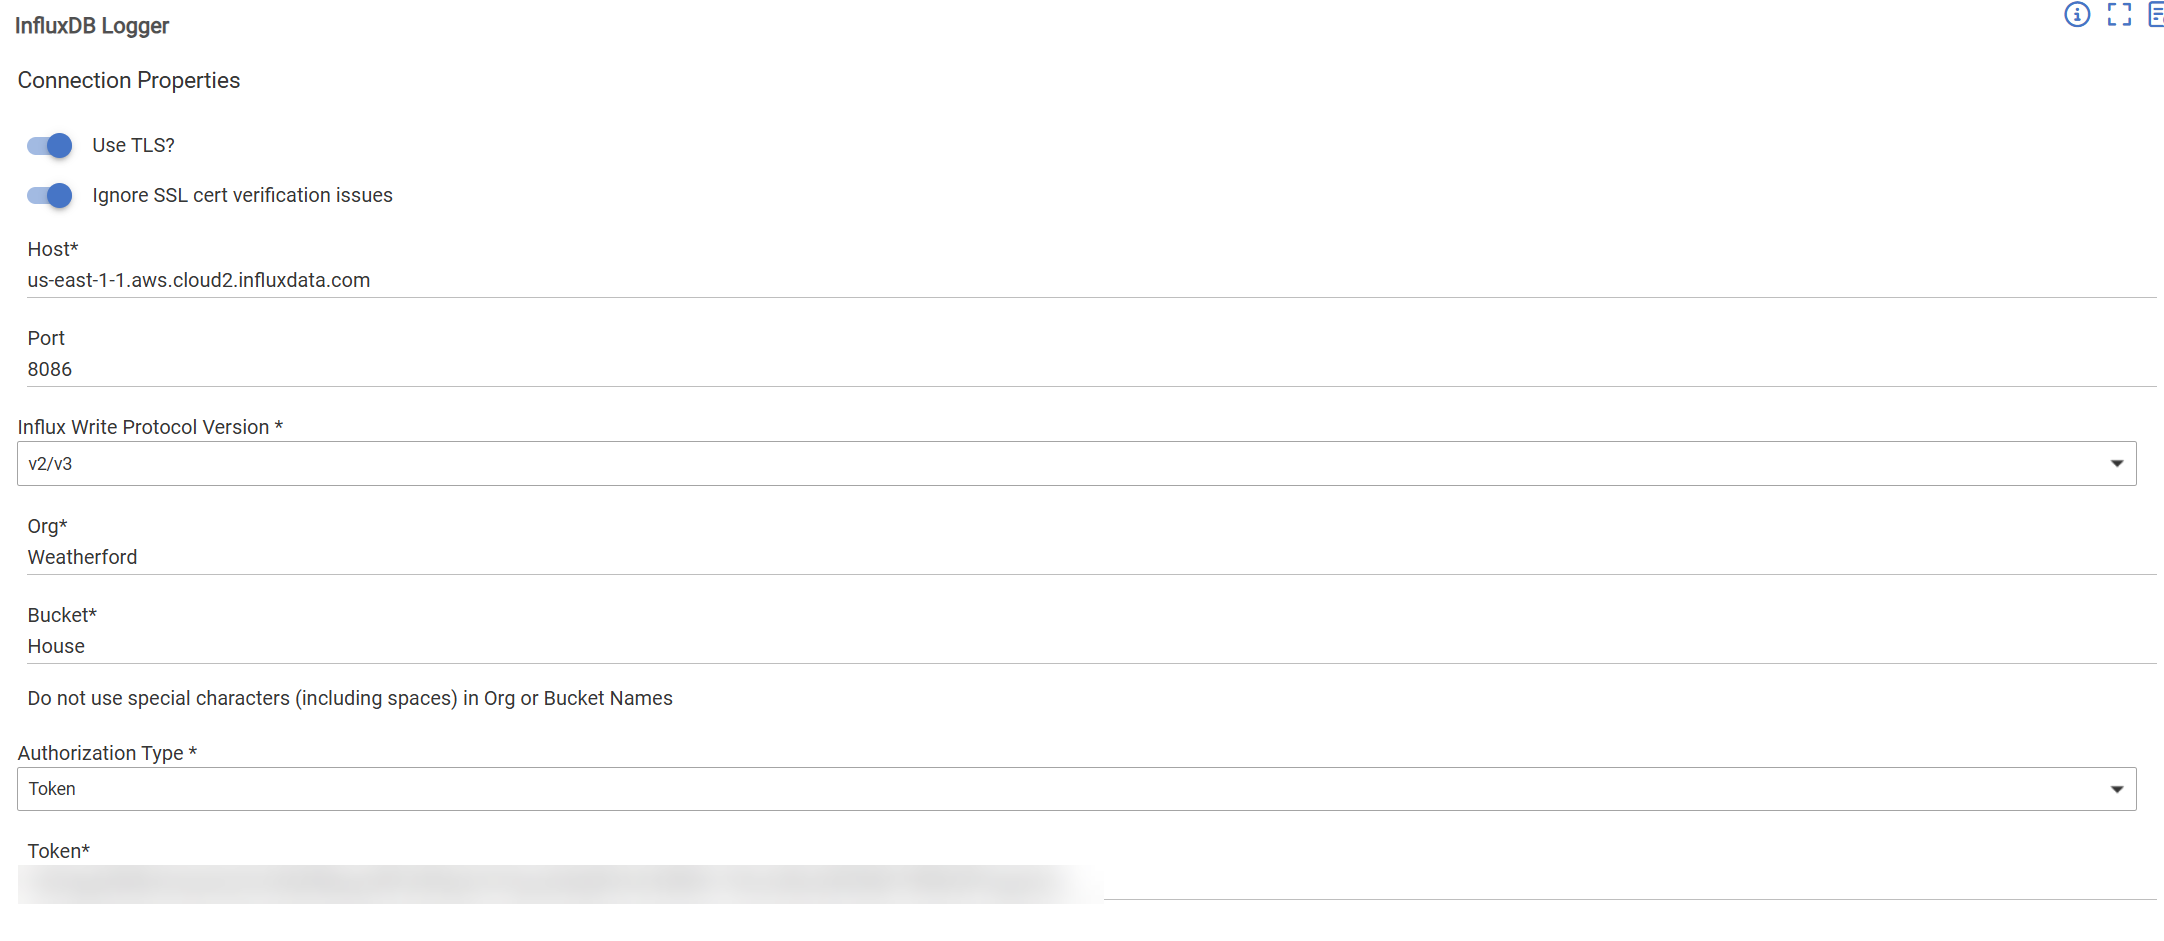
Most likely you are using the wrong port number. Check the instructions where you signed up. I'm guessing that for cloud they are using 443 instead of 8086.
I have tried multiple ports with no success, including 443.
I don't use InfluxDB's cloud service, so I'm limited in how much help I can provide. That said, I did take a quick look at the InfluxDB Cloud documentation. Looking at their curl examples, they are showing https without a port number, so it is definitely port 443.
I'd suggest going through the InfluxDB Cloud documentation here and here.
Focus on the curl examples.
Your org is also wrong. You need to use the Organization ID rather than the Organization Name.
1 Like
Changing the Org ID worked. Thank you for putting another set of eyes on this.
Hello, I added some power meters and forgot to select them in the InfluxDB Logger (Standard Attributes) app I have...I would rather just have the logger log all of hub's variables. But when I go to the Variables to Monitor section, nothing pops up. Is there something I need to do to enable this?
Devices and variables are different things.
See below for information on variables:
https://docs2.hubitat.com/en/user-interface/settings/hub-variables
Does that mean that I cannot simply ask to monitor 'power' and all devices that report power will automatically be included?
Correct. Hubitat community created Apps are not allowed to include ALL devices. Users must intentionally select individual devices to be used within an App.
2 Likes
I believe I've found a bug in InfluxDB. The version I'm running is the one where the last comment at the top is timestamped 2024-03-17; I'm not keeping up with updates because I had to hack my copy to add some attributes to energy meters to grab extra info for Sinopé thermostats, and to add "radonShortTermAvg" to "co2s" while I wait for Hubitat to properly support radon sensors.
Anyway, the problem is with keepalives on boolean hub variables: when such a variable becomes true, the change is correctly logged into InfluxDB, but at the next keepalive, it reverts (in InfluxDB) to false, despite the fact that the Hubitat's interface shows that it is still true.
I believe I've found the problem: when an event triggers a call to "encodeVariableEvent", the class of the value passed in is "java.lang.String", so in the statement:
value = evt.value == 'true' ? 'T' : 'F'
which should convert/escape the passed-in value for a variable of type boolean, the match succeeds and the value is set to 'T'. However, when a keepalive (softPoll) triggers that method call, the class of the value passed in is "java.lang.Boolean", so the match fails, and a "true" value gets translated (incorrectly) to 'F'. The fix seems to be to cast the value to a string type:
value = evt.value.toString() == 'true' ? 'T' : 'F'
This is at line 649 in the current version.
Are you sdachen?
Can you please provide debug logs for InfluxDB logger and the device driver in question? Thanks.

