I wanted my family to see the latest info on how bad COVID-19 spread is getting lately, without having to tell them every day. I realized the Hubitat could scrape some info and display it on our dashboard. It probably took me less than an hour to find something and make it work!
In Maryland, we have a good site for returning data about testing results from their arcgis page, in JSON. So I hacked a little JSON parser that I found on the forums:
https://community.hubitat.com/t/help-with-simple-http-query-device-driver
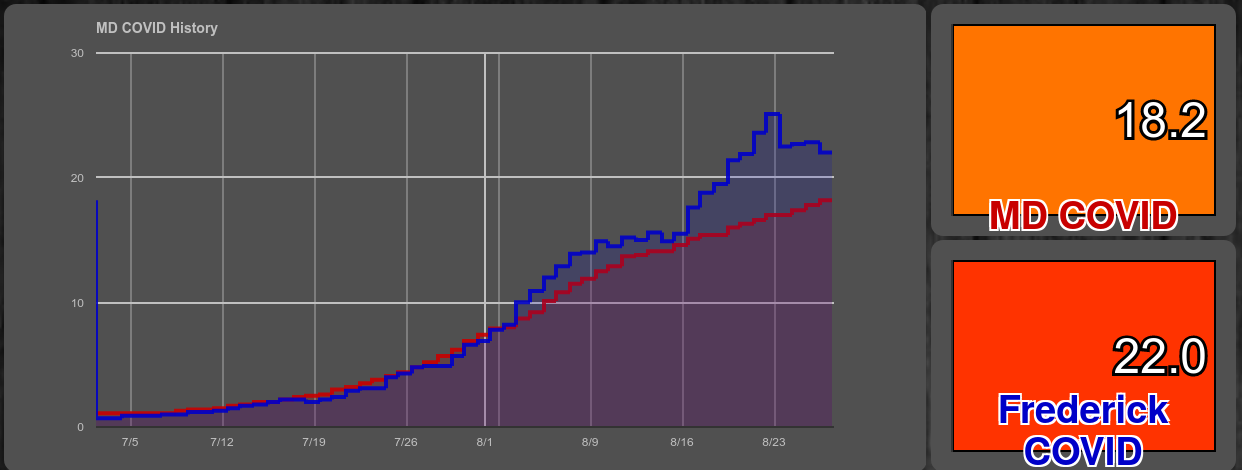
And now I pull the 7-day average of new infections per 100k population directly from the Maryland arcgis site and display it using the Hubigraph heat map graph. Bad values are red, concerning values are orange, then yellow, then green for very little community spread. Now it looks like this:
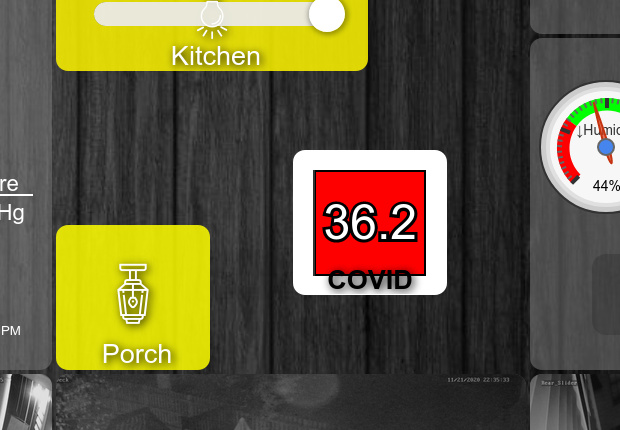
(yesterday was 35.0, it keeps going up)
The code I hacked together follows:
Summary
/*
 * MD COVID info
 */
import groovy.json.JsonSlurper

metadata {
    definition(name: "get-MD-COVID", namespace: "BrianP", author: "Ryan Stasel hacked by BrianP") {
        capability "Sensor"
	    capability "Polling"
        attribute "Statewide", "NUMBER"
    }
}

preferences {
    section("URIs") {
    	//input name: 'updateMins', type: 'enum', description: "Select the update frequency", title: "Update frequency (minutes)\n0 is disabled", defaultValue: '60', options: ['0', '60', '120', '180','360','720','1440'], required: true
        input name: "logEnable", type: "bool", title: "Enable debug logging", defaultValue: true
    }
}

def logsOff() {
    log.warn "debug logging disabled..."
    device.updateSetting("logEnable", [value: "false", type: "bool"])
}

def updated() {
    unschedule()
    log.info "updated..."
    log.warn "debug logging is: ${logEnable == true}"
    if (logEnable) runIn(1800, logsOff)
    if(updateMins != "0") {
        schedule("0 10 7/1 ? * * *", poll)
    }

}

def parse(String description) {
    if (logEnable) log.debug(description)
}

def poll() {
    if (logEnable) log.debug "polling..."
    def url = [
		uri: "https://services.arcgis.com/njFNhDsUCentVYJW/arcgis/rest/services/MDCOVID19_CasesPer100KpopulationStatewide/FeatureServer/0/query?where=ReportDate%20%3E%3D%20CURRENT_DATE%20-%20INTERVAL%20%2710%27%20DAY&outFields=Statewide&outSR=4326&f=json",
		requestContentType: 'application/json',
		contentType: 'application/json'
	]
    try {
        httpGet(url) { resp ->
            if (logEnable) log.debug resp.getData()
            def respValues = resp.data.features.last().attributes.Statewide.toString()
            if (logEnable) log.debug respValues
            sendEvent(name: "Statewide", value: respValues)
	}
    } catch(Exception e) {
    	log.debug "error occured calling httpget ${e}"
    }
}