Changed the docker to host networking and messages are being logged to the debug output.
What node are people using to write to influxdb? I see there is influxdb and influxdb batch.
Changed the docker to host networking and messages are being logged to the debug output.
What node are people using to write to influxdb? I see there is influxdb and influxdb batch.
Influxdb. You can import and customize this
Heres a question. Now that we have this node-red flow funneling the events to influxdb, it seems very stable, but im kind of done playing with node-red for now. Is there maybe a way to "export" the flow as a lean-and-mean dedicated nodeJS app which could run stand-alone and not require node-red be running any more?
Well, this is probably not what you are looking for but you can run node-red within a node-js app:
Node-RED : Embedding into an existing app and re-use the flow that you created. But you are still running the full node-red stack, just encapsulated in a node-js app.
Or, you can write a new node-js app that listens to the event socket and writes it to influxdb with the node-influx plugin:
That's probably 50 lines of code.
But just exporting the flow and magically running it in a node-js app is not possible.
Thanks Dan, Yep the 50 lines of code thing is more like what im picturing. Looking at your logger app, it seems to have the connectivity bits in it already, just needs the "logic" from your "Filter Attributes" and "Set Influx Data" nodes wired up between the socket listener and the influx plugin. That would make a super lightweight solution.
Yes, it is really not a lot of code
@btk, I recently started using your InfluxDBRefresh flow instead of the Maker Api pulls. Thanks for sharing.
Question: The part of the flow that "Finds Stale data" does not seem to do anything with the deviceList(aka State) data. Was this left over from a previous attempt that is no longer needed? It seems like the entire part of the flow that saves the state info to the flow context is no longer necessary. Am I correct or missing something obvious?
First off...thank you for all of this! After a few days of tinkering with it I finally have it up and going. I am running MariaDB for mySQL instance. Followed everything and it works! ![]()
So now that this is "working" I am seeing an error in my Node-Red logs:
6 May 15:06:29 - [error] [mysql:Logging DB] Error: ER_PARSE_ERROR: You have an error in your SQL syntax; check the manual that corresponds to your MariaDB server version for the right syntax to use near 'color:green'>[true]','Action - Office PC: Office - Zooz Power Strip - CH1' at line 1
Any thoughts on how to resolve this?
Do you have a device with html formatting in one of the attributes? Looks like your Zooz Power Strip. I assume it's a custom driver that looks 'pretty' on the device page.
Nope this is the standard generic Zooz Power Strip in HE
Ahhh... I thought you were using the event socket but looking at you error again it seems you are using the log socket. It looks like a Rule Machine (or something similar) log is causing an issue because it contains html tags.
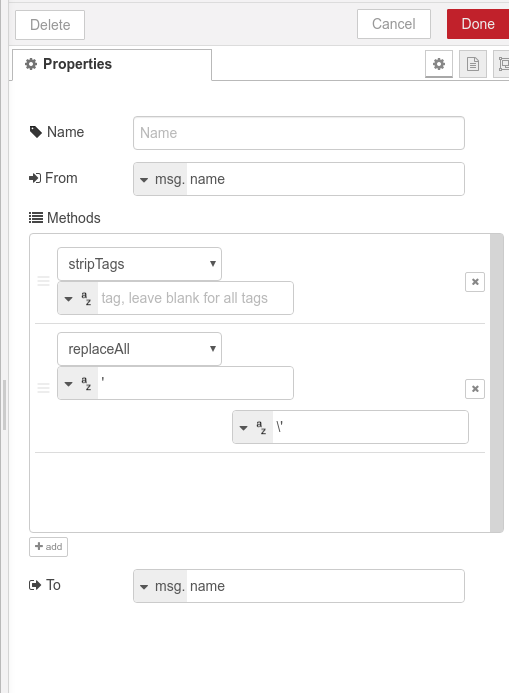
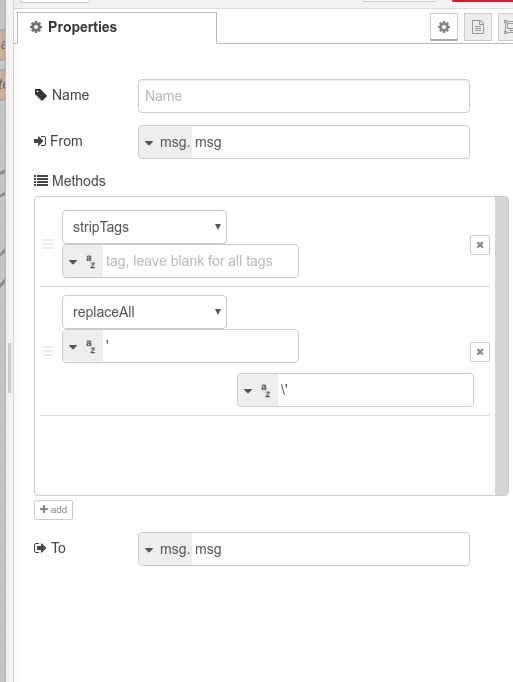
That's exactly what it is. I use the string node (node-red-contrib-string) to strip out any html tags before inserting into the DB.
Excellent! I have installed the recommended add-on but now I am unsure where and what to add. Sorry for the n00bie questions but this is all new AND intriguing to me. SO excited to be using Node-Red with an actual real-world application that helps me. 
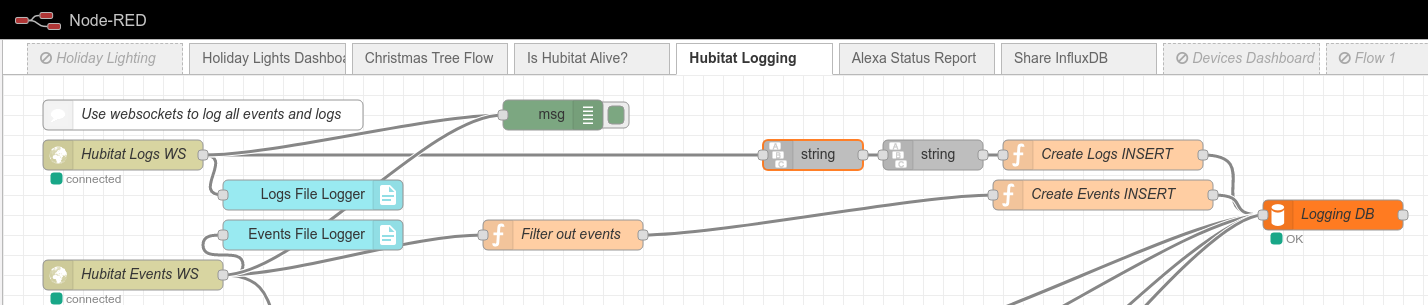
No worries! This is where I have it:
The reason for two nodes inline is one acts on msg.name and the other on msg.msg.
You can see in my screenshot that I use it also for holiday lighting. My outdoor Pixels are all MQTT controlled. I use NodeRed for those (plus my 6 LightShowPIs).
This is very cool!
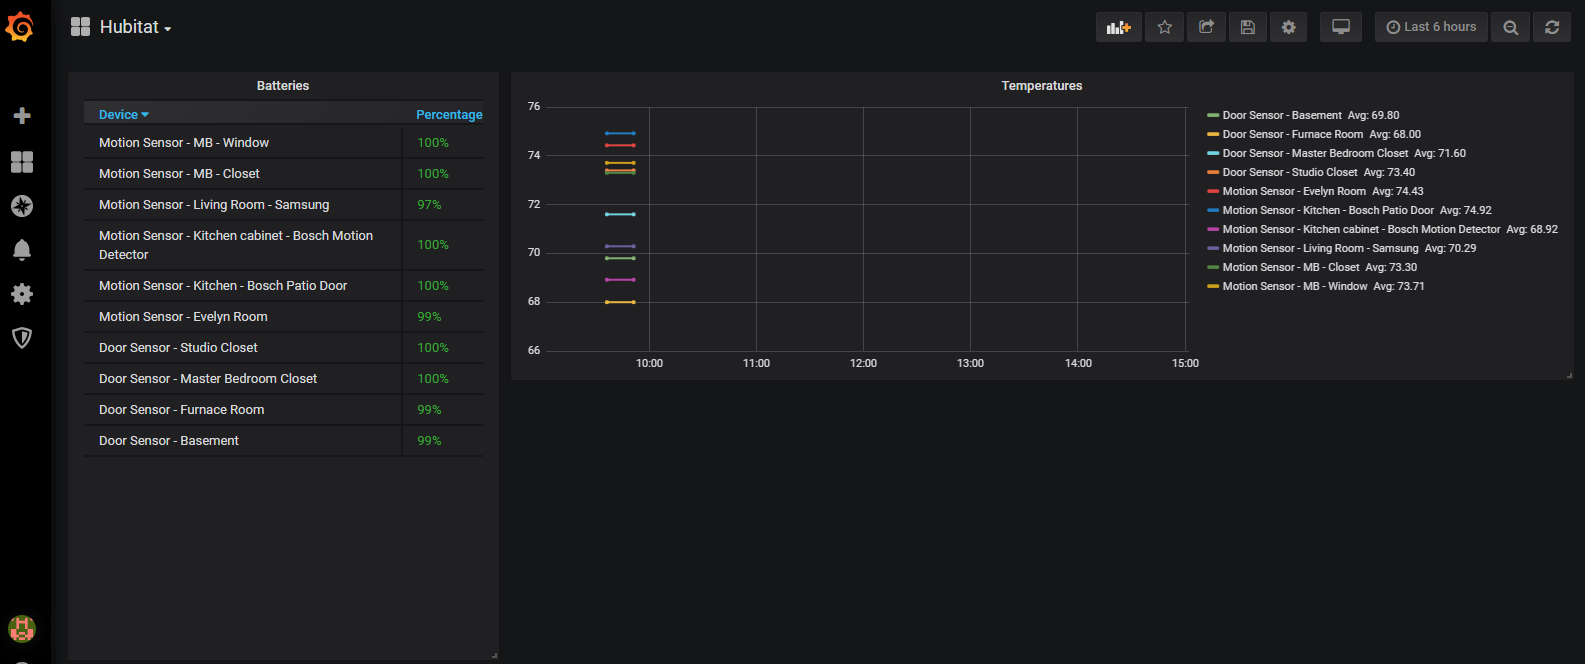
Alright so now I see batteries, temperature. I do not see logs/events doing anything in the database. The tables are created but I am not seeing any data in grafana when selecting information. Thoughts?
Check NodeRed to see if any exceptions are being thrown there. That's the only reason I can think of that you'd not see any data in events or logs. Batteries and temps are pulled via the maker API (which reminds me that I need to update my nodes to use the new /attribute/:attribute: path in the Maker API).
I used this exact setup but it put quite a load on the hub when doing the Api calls. I switched over to a version of @btk's InfluxdbRefresh flow. My performance monitor has been relatively flat since then...even during maintainence.
are your web sockets connected?
Yes. Everything is connected.
Download the Hubitat app