I get an error at line 185, but I deleted line 186 and it validates after that. then it seemed to work.
thanks
I get an error at line 185, but I deleted line 186 and it validates after that. then it seemed to work.
thanks
making progress, but now i'm getting this error. its throwing that error for every event and nothing is writing to my influxdb instance.
object
topic: ""
payload: "HE Logging has thrown an error"
_msgid: "d1c26d82.8a284"
statusCode: 200
headers: object
connection: "close"
date: "Sat, 06 Apr 2019 20:39:17 GMT"
content-type: "text/json"
server: "Jetty(9.4.z-SNAPSHOT)"
x-node-red-request-node: "1e6f9c70"
responseUrl: "http://192.168.20.22/apps/api/129/attribute/battery?
access_token=*******************"
redirectList: array[0]
payload_unsplit: array[45]
[0 … 9]
[10 … 19]
[20 … 29]
[30 … 39]
[40 … 44]
name: "battery"
value: "87"
deviceId: "68"
displayName: "Motion Sensor - Upstairs Guest Bath (Connect S)"
unit: "%"
error: object
message: "Error: Internal Server Error"
source: object
stack: "Error: Internal Server Error↵ at new ServiceNotAvailableError
(/usr/src/node-red/node_modules/influx/lib/src/pool.js:37:28)↵ at /usr/src/node-
red/node_modules/influx/lib/src/pool.js:272:49↵ at ClientRequest.<anonymous>
(/usr/src/node-red/node_modules/influx/lib/src/pool.js:79:13)↵ at
Object.onceWrapper (events.js:315:30)↵ at emitOne (events.js:121:20)↵ at
ClientRequest.emit (events.js:211:7)↵ at HTTPParser.parserOnIncomingClient
(_http_client.js:558:21)↵ at HTTPParser.parserOnHeadersComplete
(_http_common.js:119:17)↵ at Socket.socketOnData (_http_client.js:454:20)↵ at
emitOne (events.js:116:13)"sorry, for clarification I replied to flow I'm trying to get working.
thanks
Update:
seems to be working. lot of weirdness. My influxdb database kept getting corrupted or something. It would work for a while, then start spitting those errors. I restarted the influxdb docker instance a couple times, and deleted and recreated the database a couple times. Seems to be working for the time being.
update 2: it seems to break when a new event type happens. I noticed that my locks hadn't appeared in the list yet, so I locked and unlocked a door and then everything froze up until I restarted influxdb. after I restarted, the lock value is present in grafana and it works fine.
Did you end up fixing the issue?
I think so. Here's the link:
Have any of you done anything with feeding the hub logs into influx or anything else that would make them easily searchable? I've worked with ElasticSearch and Kibana in the past, but if there's an easy-enough way to make them available in Chronograf, I'd prefer to avoid ES and its maintenance overhead.
I push them into MySQL. Then I just query on them as I need to.
Thanks, this seems to be working. My battery levels for the devices all showed up not long after I deployed the Node Red flow.
Edit: Also that performance monitor flow is great. I am trying now to get things as reliable as possible and strip out as much third party apps/drivers as possible. I still have some custom drivers/apps though that I don't think I can easily replicate with stock app/drivers, but I do not think any of them should cause excessive load on the hub.
I still do occasionally get the "zigbee network is offline" message, but it has been less frequent since I removed the InfluxDB app.
Also I noticed the hub seems more responsive when accessing the web ui since I disabled all device descriptiontext logging.
Also what is your average hub response time? @btk
Loading the app list averages right around 1.5 seconds.
Timing the toggling of a virtual switch averages around 0.3 seconds.
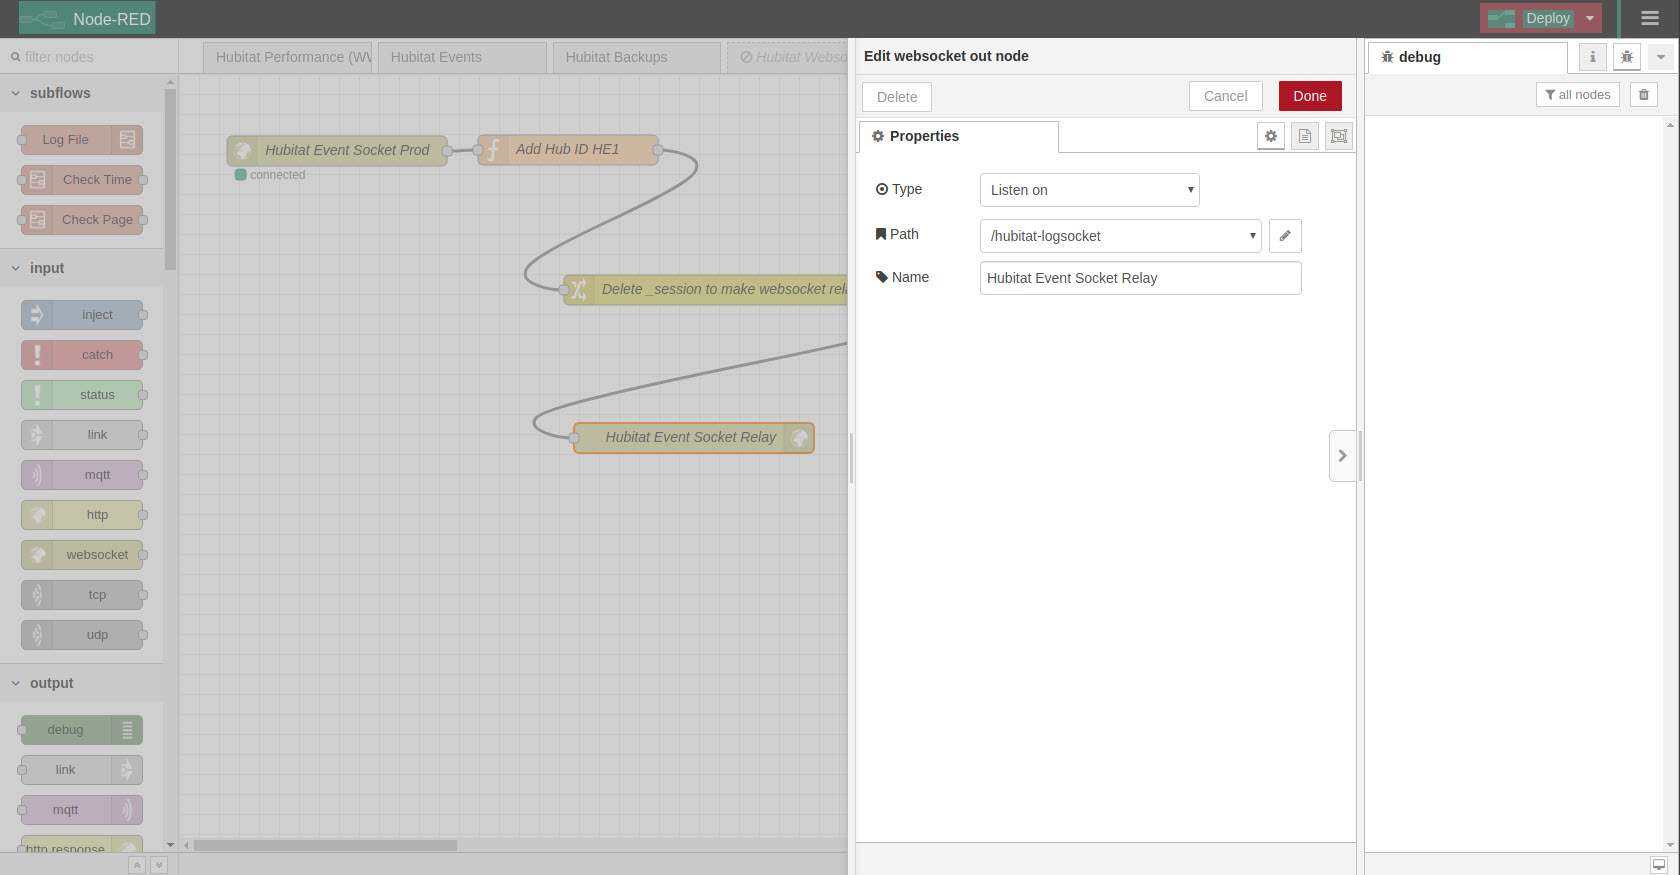
I imported your flow for this but nothing is written to the database. From what I understand is that all other flows that require a websocket connection should be setup to "listen on" with the path pointed to "/hubitat-eventsocket"
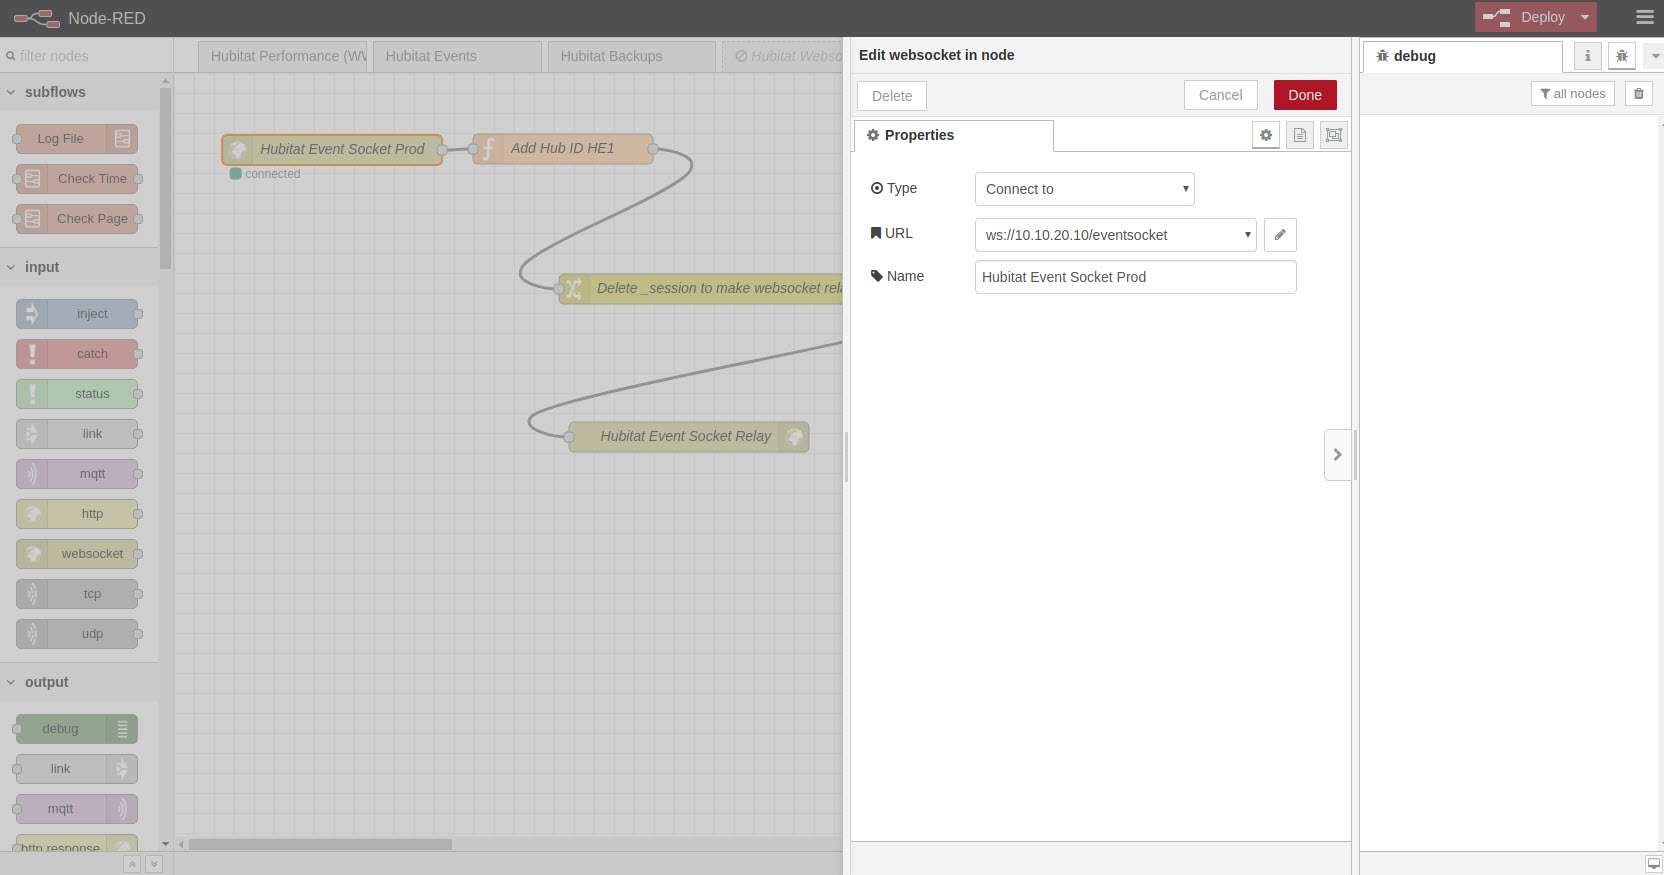
That is correct. Have you changed the IPs in the "Hubitat Event Socket Prod" and "Hubitat Event Socket Dev" and made sure that these are still set to "entire message"?
I'm probably being dense but what is the purpose of this? Don't both the web sockets remain open anyway? One for each hub. How is converging them into one node-red socket beneficial?
Yes and they do say "connected"
I have several node-red flows that want to listen to the eventsocket of my Hubitats. Instead of each flow opening it's own connection, I converge them. This way I only have 1 websocket connection to hubitat and don't have to worry of resources
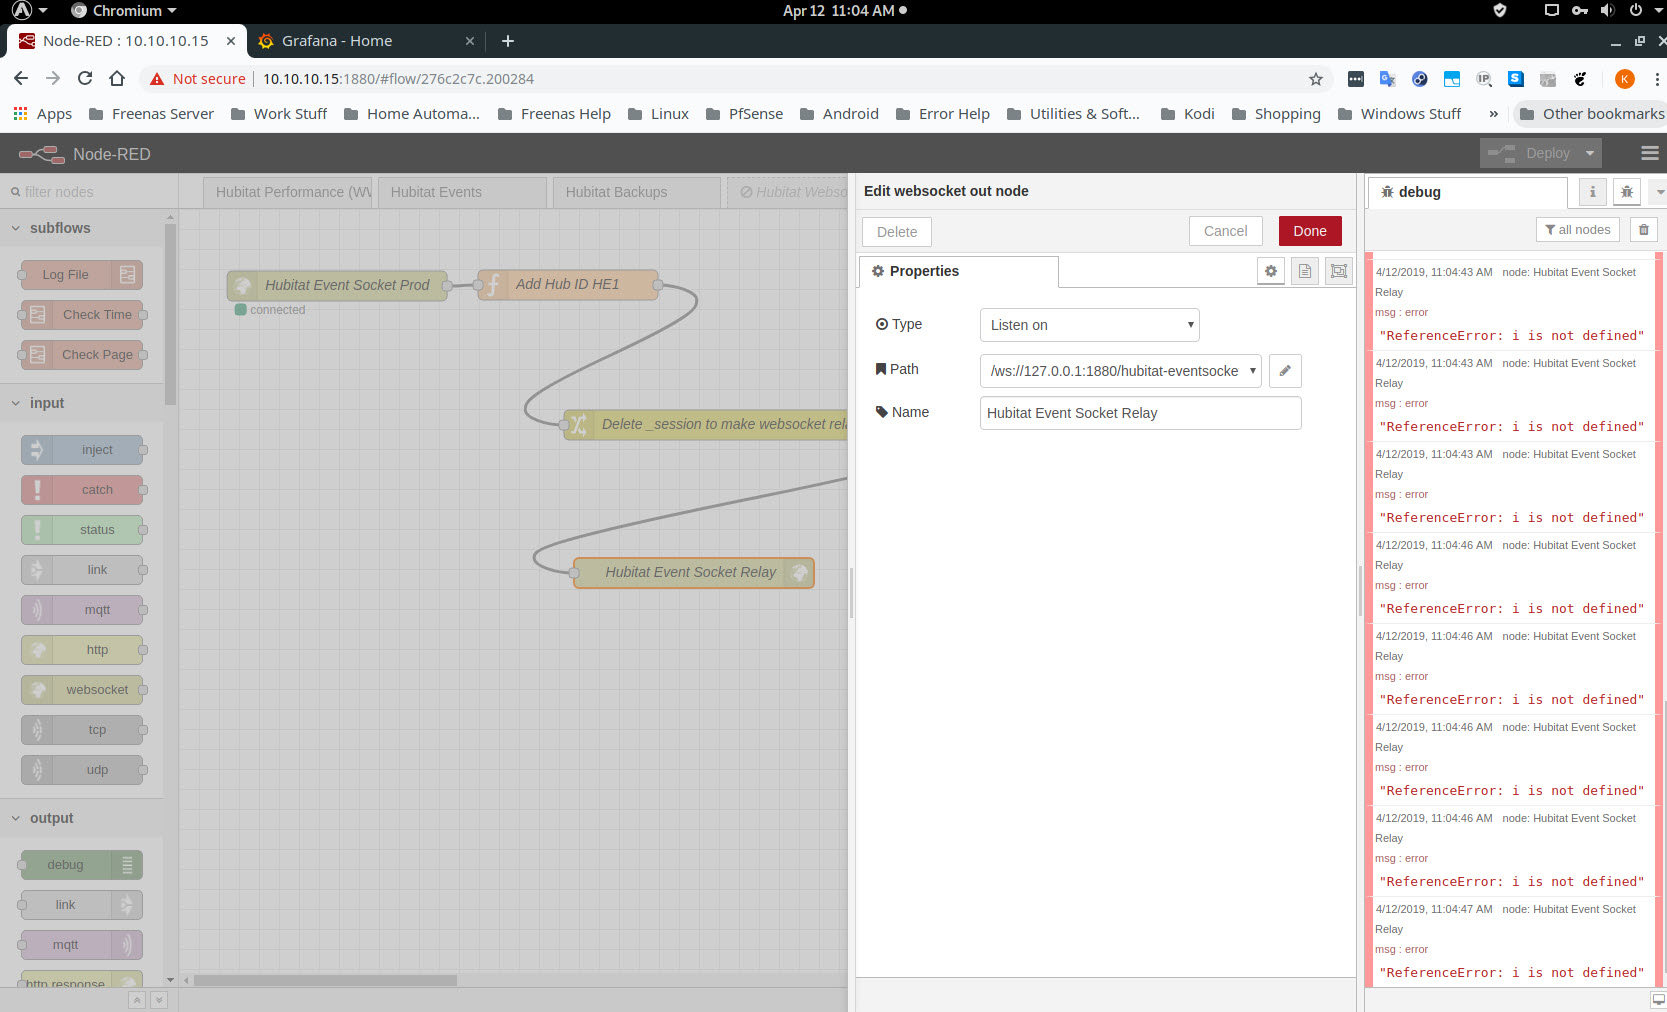
And then your follow on flow, how do you have the full URL set? Did you include the node-red port in the URL?
This is how its setup. The other flows are setup with a websocket that "listens on." with "/hubitat-eventsocket" for the path.
What is the URL in your browser to get to the Node-Red interface? I have an idea....
Just the IP and port: http://10.10.10.15:1880
Not sure why this matters?
Edit: Or are you saying I need to add the port of node-red to the websocket that "listens" for each flow?
Exactly!!!
your ws url has to be
ws://10.10.10.15:1880/hubitat-eventsocket
Download the Hubitat app