Hubitat > NodeRed > MySQL > Grafana (LONG READ)

This has been a very helpful thread, and I have had my Node-RED/Influx/MariaDB/Grafana integration working smoothly for a couple weeks now. But I just realized that the Node-RED websocket node does not appear to reconnect after the Hubitat hub is rebooted. Although it showed as connected in the UI, I had not received any messages from Hubitat since I rebooted it a couple days ago. (Note to self: set up some alerting if no data received for N minutes.)

I had to re-deploy my flow, at which point the WS connection began working and messages started flowing again.

Is this expected behavior of the Node-RED websocket node? I tried to find some contributed reconnect/retry flow, but didn't see one. Does anyone have automatic reconnection working?

I've rebooted my hub several times over the past couple of months. My websocket has always reconnected.

Mine also reconnects without issue.

@raidflex, @stephack, thanks for the replies.

I decided to try rebooting Hubitat while paying attention to the Node-RED flow, and you're right, it does appear to have reconnected immediately after reboot. I'm not sure why it didn't reconnect a couple days ago. It does seem to be correlated with the reboot, as the last message logged was just a few seconds before I rebooted. In any case, I guess I'll just need to keep an eye on it and try to do more debugging if it happens again.

I too have issues with websockets and node-red on my RPi, fairly old version of node-red. I have to actually restart node-red to get it to reconnect.

I was out of town for work and came back to find that, once again, my Node-RED integration hadn't received anything from either the events or logs websockets in a week. I don't think this was tied to a Hubitat hub restart, though.

Re-deploying the Node-RED flow was enough for it to reconnect. I'm running Node-RED 0.20.5, which is fairly recent, so if we are indeed seeing the same problem, I don't think it's specific to the version of Node-RED.

does anyone have a complete working flow for influx? one that continues to send data to influx even if the device hasn’t updated so that devices don’t disappear in grafana? i’ve been trying to piece things together from a few posts and am not having much luck.

thanks

I have this working for me. I used @btk's flow as a template and made a few tweaks. Essentially it does the following:

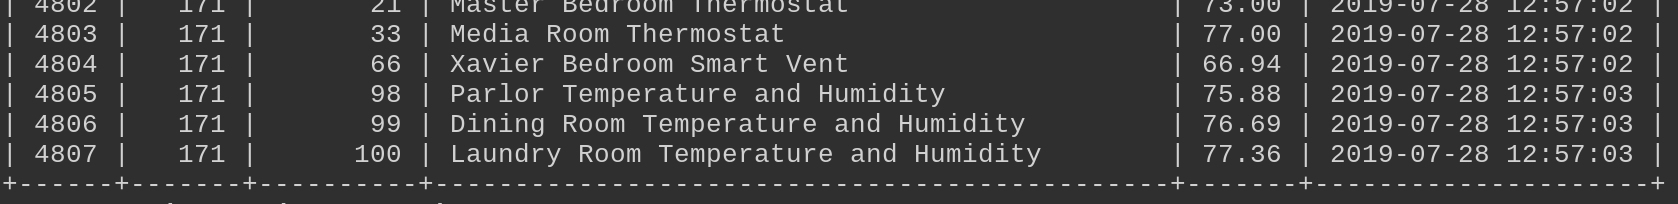
  • Queries the database for latest values of temp, battery and humidity measurements.
  • Scans the timestamps for anything that hasn't been updated in the past 15 minutes.
  • Pushes those measurements back to the database with updated timestamps.

This process repeats every 5 minutes. Here's a picture of my flow. The section described above, is below the red line.

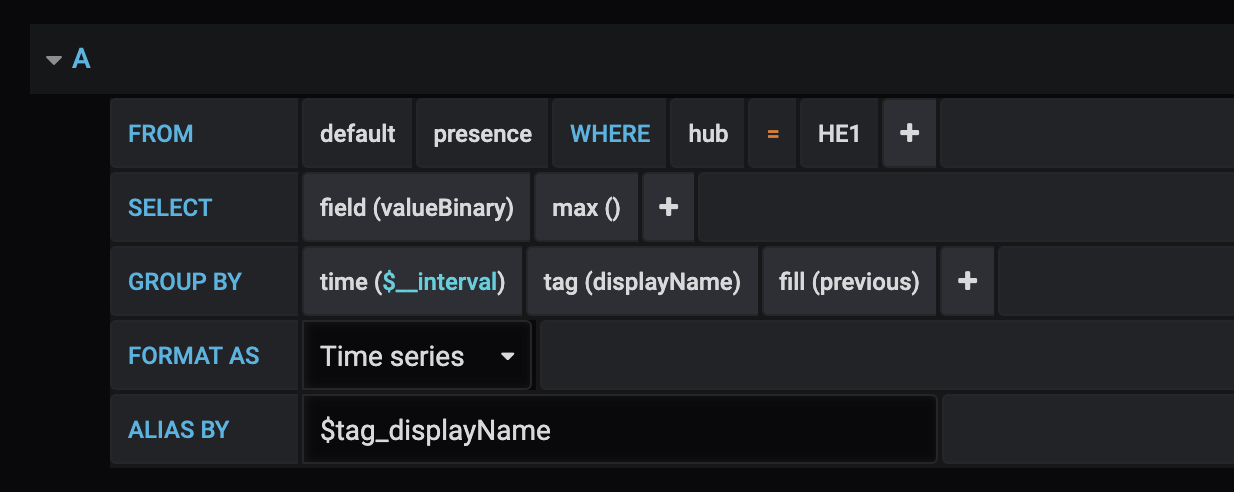
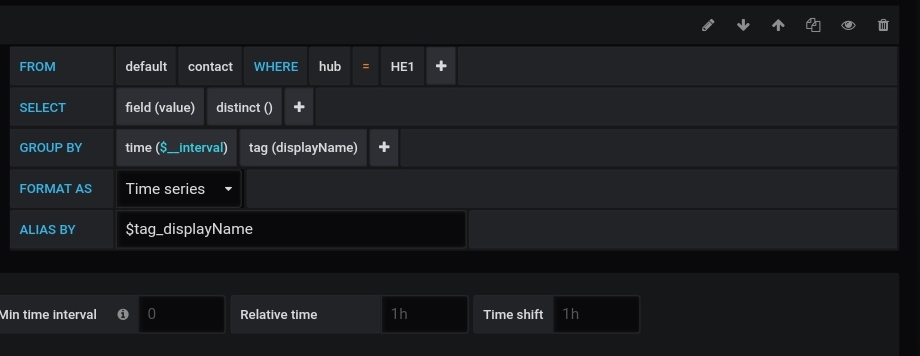
This is that portion of the flow. You will need to attach the last node to you Influx node as pictured and also edit the "Build InfluxQL" node to set your influx database name.

[
    {
        "id": "c2d313b9.6088b",
        "type": "inject",
        "z": "6f5a02a4.0a0dac",
        "name": "w.1s r5m",
        "topic": "",
        "payload": "",
        "payloadType": "date",
        "repeat": "300",
        "crontab": "",
        "once": true,
        "onceDelay": "0.1",
        "x": 170,
        "y": 420,
        "wires": [
            [
                "66c366b.cd2bc98",
                "dc937be3.d13a78",
                "d3b80106.60246"
            ]
        ]
    },
    {
        "id": "ef96983d.de2838",
        "type": "function",
        "z": "6f5a02a4.0a0dac",
        "name": "Find Stale Data",
        "func": "now = new Date();\n//state = flow.get(\"deviceList\");\n\nupdates = [];\nmsg.points = msg.payload;\npoints = msg.payload;\n\npoints.forEach(point => {\n    delta = ((now - point[\"time\"]) / 60000)\n\n    if (delta > 15) {\n        update = {\n            measurement: msg.measurement,\n            fields: {\n                // value: state[parseInt(point.deviceId)][]\n                value: point.value\n            },\n            tags:{\n                hub: msg.hubId ? msg.hubId : \"HE1\",\n                deviceId: parseInt(point.deviceId),\n                displayName: point.displayName,\n                unit: point.unit,\n                synthetic: true\n            },\n            delta: delta,\n            timestamp: new Date()\n        };\n        \n        updates.push(update);\n    }\n});\n\nmsg.payload = updates;\n\nreturn msg;",
        "outputs": 1,
        "noerr": 0,
        "x": 920,
        "y": 420,
        "wires": [
            []
        ]
    },
    {
        "id": "dc937be3.d13a78",
        "type": "change",
        "z": "6f5a02a4.0a0dac",
        "name": "Humidity",
        "rules": [
            {
                "t": "set",
                "p": "measurement",
                "pt": "msg",
                "to": "humidity",
                "tot": "str"
            }
        ],
        "action": "",
        "property": "",
        "from": "",
        "to": "",
        "reg": false,
        "x": 350,
        "y": 380,
        "wires": [
            [
                "56cdf119.0ed5e"
            ]
        ]
    },
    {
        "id": "66c366b.cd2bc98",
        "type": "change",
        "z": "6f5a02a4.0a0dac",
        "name": "Temperature",
        "rules": [
            {
                "t": "set",
                "p": "measurement",
                "pt": "msg",
                "to": "temperature",
                "tot": "str"
            }
        ],
        "action": "",
        "property": "",
        "from": "",
        "to": "",
        "reg": false,
        "x": 350,
        "y": 420,
        "wires": [
            [
                "56cdf119.0ed5e"
            ]
        ]
    },
    {
        "id": "56cdf119.0ed5e",
        "type": "function",
        "z": "6f5a02a4.0a0dac",
        "name": "Build InfluxQL",
        "func": "msg.query  = 'SELECT \"deviceId\", last(\"value\") AS \"value\", unit ';\nmsg.query += 'FROM \"YOURinfluxDB\".\"autogen\".\"' + msg.measurement + '\" ';\nmsg.query += 'GROUP BY displayName';\n\nreturn msg;",
        "outputs": 1,
        "noerr": 0,
        "x": 540,
        "y": 420,
        "wires": [
            [
                "3e682976.fccf96"
            ]
        ]
    },
    {
        "id": "d3b80106.60246",
        "type": "change",
        "z": "6f5a02a4.0a0dac",
        "name": "Battery",
        "rules": [
            {
                "t": "set",
                "p": "measurement",
                "pt": "msg",
                "to": "battery",
                "tot": "str"
            }
        ],
        "action": "",
        "property": "",
        "from": "",
        "to": "",
        "reg": false,
        "x": 350,
        "y": 460,
        "wires": [
            [
                "56cdf119.0ed5e"
            ]
        ]
    },
    {
        "id": "3e682976.fccf96",
        "type": "influxdb in",
        "z": "6f5a02a4.0a0dac",
        "influxdb": "a621305e.2cea1",
        "name": "Get Latest Data",
        "query": "",
        "rawOutput": false,
        "precision": "",
        "retentionPolicy": "",
        "x": 730,
        "y": 420,
        "wires": [
            [
                "ef96983d.de2838"
            ]
        ]
    },
    {
        "id": "a621305e.2cea1",
        "type": "influxdb",
        "z": "",
        "hostname": "127.0.0.1",
        "port": "8086",
        "protocol": "http",
        "database": "nucflux1",
        "name": "NucFlux1",
        "usetls": false,
        "tls": ""
    }
]
3 Likes

cool, i think i've got it set up. why are you only refreshing the data for those 3 variables? it seems like everything falls off influx if I zoom in on the time range sufficiently. presence, switches, etc. are you just not graphing that stuff?

A device can report it's attributes on a consistent basis but it will only create an event if that value has changed. Since these values can sometimes take a long time to change(especially battery), they can drop off. The flow ensure it resends the last value received over and over again until it actually changes. This ensures the graph is accurate.

Other events like on/off and open/close are binary (ie one state or another) and shouldn't need to be graphed the same way.

Maybe I'm not using grafana correctly then, b/c with the following graph, presence sensors fall off if there is no change within the set time window.

As an example. This how some of my Contact data is represented in Grafana.

I'm not sure what type of graph you are making but where you have "max" should probably be "distinct".

This is my query for the above visualization (I use the same format for presence). It a query for a Discrete visualization.

1 Like

I got that working with the Discrete visualization. Previously I was using statusmap.

I like statusmap, but I may like discrete even better.

thanks!

Hi,

I have read this post with interest and thought I'd give this ago, but have run into a number of problems.
I have installed node-red and MariaDB on my QNAP Server and set about running this flow. However, I have the following problems, can anyone advise how to get around them?
(1) In the fist instance I have struggled to connect to the database; I have set up the tables on my server, which reads QMariaDB:3308 Database:hubitat_logging. When i set it up in node red, what do I fill in for the Host, Port, User, password and Timezone. I have tried a number of options but I get a message about connection refused.
(2) I then looked at the websockets and file logger and there is no file being saved, even though the websocket is marked connected. I have set up a shared folder on the QNAP (called hubitat) and set up (for example) the logsocket as path "/ws/://IPADDRESS/logsocket" send/receive is set to "payload" and Type is "Listen on", for the Logs File Logger I have set up the File name to "/hubitat/logs.json". I would have expected to see a new file in the hubitat folder, but there is nothing there.
Any advice is welcome.

Time offsets between MariaDB and Grafana are driving me NUTS... Any pointers?

In MariaDB the time looks right, time listed matches current local time:

Time and timezone on the MariaDB docker are correct - both indicate America/Chicago - my timezone.

When I make a dashboard in Grafana, though, all of the data is in UTC... If I set the dashboard to UTC instead of local browser time, the data has the right timestamps, but then all of the dashboard relative times are wrong... Time -6h for a trend has 5 hours of blank space at the front.

I believe @aaron has this running with Mariadb and hopefully has some pointers for you. I used influxdb myself

I was going to do it in InfluxDB too, but was having trouble building the tables. lol. So I bailed and did it in MariaDB.

You are probably an advanced db user. I simply created the db and piped the formatted data from the flow directly to it. The tables were built by the flow and id not require anything from me.