Hubitat > NodeRed > MySQL > Grafana (LONG READ)

Does anyone know if NodeRed can restart itself? When I restart my hub sometimes the socket connections don’t reconnect. I have my flow notifying me of this situation but it would be awesome if I could invoke the same action as Deploy - Restart Flows via a node. Would be nice to listen for the systemStart event and perform this automated restart of the flows after a delay.

I am running NodeRed in a docker container on my NAS. I did some online searching and tried a few things that didn’t work. Thanks in advance.

I started looking into this a while back and it fell on the back burner. I remember getting the flow that had my websocket redeployed using the NR http api below:
https://nodered.org/docs/api/admin/methods/post/flows/

For some reason I never finished looking at this...can't remember why. After I finish peering into my new rabbit hole (home assistant / mqtt), I'll look into this again.

Thanks I am using some of @btk’s watchdog

But his is executing a command on the “server” to restart the flow. Unfortunately I couldn’t get that to work with my docker setup but your post flow links look promising. I will post back here when I find some time to try it.

I know it's possible to reset a container from within itself, but it's a PITA. I rarely run docker, so my knowledge is a bit spotty.

Life and death of a container - DevOpsion - Medium explains it pretty well on how to possibly manage a container from within that container itself.

I read somewhere recently on here about WebSocket ping/pong being the solution to stuck half open sockets. I dont know if the node-red ws connectors support it, or if the HE does on its end also.

1 Like

@stephack and @corerootedxb thank you for the ideas and inspiration. The article that Stephen provided with the Post was helpful and after doing a little messing around, I got my flows to restart via PostMan and a simple http Post passing the following header:
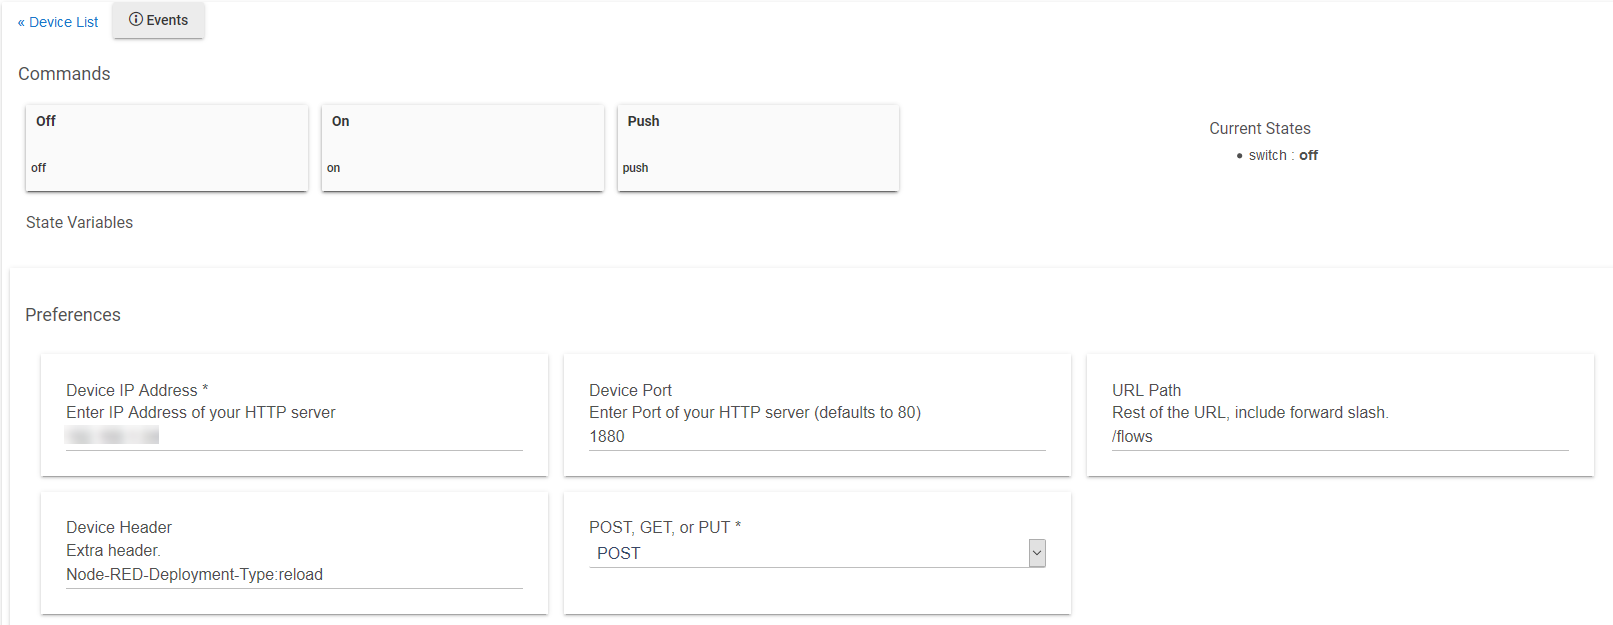
Node-RED-Deployment-Type:reload

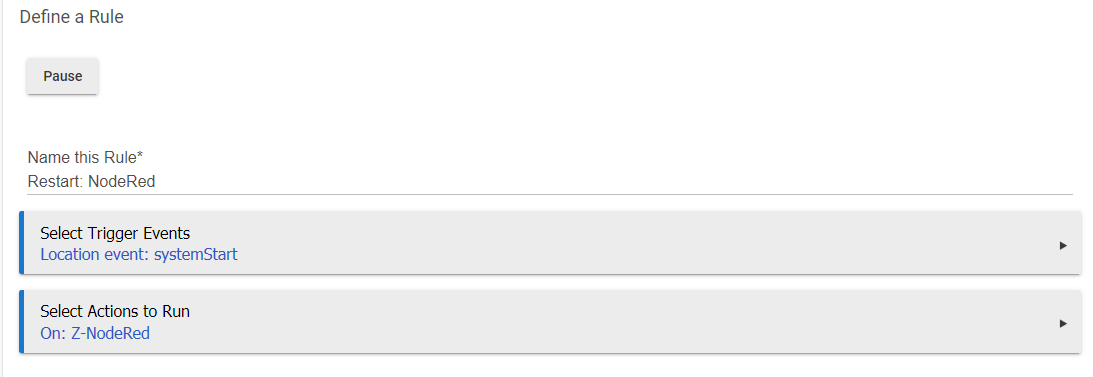
I was hoping to use a simple RM rule that was triggered from the Location systemStart event but I couldn't figure out how to include a header in the rule action so I gave up. My NodeRed container kept logging various errors. I ended up using a slightly modified @ogiewon's HTTP Momentary Switch driver where I have included an extra header preference:

Then I setup a rule triggered by a hub restart to turn on this momentary switch:

3 Likes

That's exactly where I stopped...proof of concept. Glad to see you took it to completion. I randomly lose connection (even if HE hub did not restart) so I need to think out how to make my Watchdog node monitor the socket for disconnects and then execute the momentary switch to reload the flow.

It hasn't happened in a while so my motivation is low to work on this but thanks for sharing @ritchierich. I'll be reaching out for that modified driver when I'm ready to tackle this ..back to my Hassio/Mqtt black hole.

1 Like

I went ahead and pinged the node-red devs about implementing ping/pong heartbeat on the websocket node here, we'll see what happens.

1 Like

Hoping for some help here. Probably missing something simple. First time node-red here and I've tried a bunch of stuff, so I have two different questions to ask ...

Simple enough flow ...

image

HE Event is configured as such ...

The filter ...
image

The Set Influx Data (thanks to -- someone on here, sorry, can't find the source!)

And the Influx DB ...

--- First issue ---

image

A 'TypeError' debug message that I can correlate to line 166 of the Set Influx DB that parses msg.value.match. I was able to overcome this by changing eventsocket receive from 'payload' to 'entire message'.

image

Is this the correct config, or is there some reason my payload setting is not working as expected? I've seen both varieties posted here, but at least one stated that changing to 'entire message' is what fixed it for them and that seems to work for me as well, but wanted to make certain.

--- End First Issue ---

So, now that I tweaked to 'entire message' on the payload, I adjusted the filter accordingly ...
image

---Start Second Issue ---

And now it seems to pass data all the way to the InfluxDB connector, but then fails because there is 'No measurement specified', however if I look in the payload of the debug message, I can see the measurement type is being set.

Going back to my InfluxDB config, I have left the 'Measurement' setting blank and I think that, as per the tip at the bottom of that screen, it should read the measurement value from the payload.

image

--- End Second Issue ---

This is the part I am stuck at. Should I be putting a value in that 'Measurement' config box, or am I not passing values properly to start with?

Any help would be greatly appreciated!

OK ... answered my own question. Reading up a bit more on the InfluxDB flows, it turns out that using 'influx batch' is the porper way to handle the array values that I was seeing in the debug payload. I was using the standard 'influxdb out' to start, but switching to 'influx batch' now parses out the measurement type and values as expected!

image

My first question is still outstanding --- do I need to read the entire message, or is just the payload an option ... or does it really make any difference as long as it works?

You need the entire message because the event socket messages are in a Json format that NodeRed won't push directly to msg.payload. However, in terms of performance, it is fine as NodeRed disposes the message object when it goes out of scope anyhow. Think of needing the entire message object as a simple inconvenience.

You could stuff the entire message object into msg.payload by using something like the Switch node, but there really isn't any need to unless your flow gets more complicated.

@corerootedxb Thank you for the explanation! My concern was the performance impact, but based on your description it is a minimal, if any, impact and a necessary evil to accomplish the logging.

1 Like

No problem! There are other ways as both the event socket and log socket can be captured from just about any programming language. With what Hubitat gave us with the sockets, the sky is the limit in terms of reporting. I honestly can't tell you the last time I even looked at the Logs page on my hub.

Thanks SO much for this post and the previous. I just jumped down the Rabbithole this morning, and was managing to get my data to the debug window, but immediately started running into the "No Measurement Specified" error.

Now, I'm beginning to see Humidity, Power and Temperature data in the "MEASUREMENTS" (table?). Woot! Of course GRAFANA remains to be figured out, so I may not be out of the woods yet.

Question to all: do I need to set any filters in the filter box? I have, but I don't know if that is limiting the messages that get passed to Set Influx Data or not...and if it is, can I use a filter like msg.payload contains * to get all messages?

Thanks!
S.

Yet another voice chiming in to say thanks for all of the hard work on this tutorial and the contributions from helpful community members. I've finally succumbed to the temptation and put together the setup from @corerootedxb's original post above, including the MySQL (MariaDB) database.

A question for the database pros, though: I see that a lot of folks prefer InfluxDB over MySQL. That intuitively makes sense, as I understand that the former is geared toward time series data. Plus, it sounds like folks have had headaches with timestamp alignment between MySQL and Grafana, which sounds like the sort of thing that would drive me nuts.

I've considered switching to InfluxDB since I'm not too far in. However, are there limitations I should be aware of before making a change? I thought I'd read something about InfluxDB being able to keep a longer history, but only keeping some subset of descriptive statistics. (I'm a database n00b, so please forgive my ignorance.)

TL;DR Experienced Hubitat data wranglers, should I stick with MySQL or jump ship to InfluxDB?

1 Like

influxdb all the way for me, its integration with Grafana is wonderful. You can set up the tables to keep the data forever, or expire it at a certain age. One of the best features is when you add a device to HE, its data just starts showing up on the Grafana charts with no edits or adds needed at all.

3 Likes

I use both actually. I use Influx for graphs but use MySQL for other things. I push the events and logs into MySQL for historical searching purposes. I have a MySQL table called batteries that I update the reported battery value and then a last updated time stamp every time any sort of event happens on that device so I can see if a battery device dies. This is done via DB trigger on events table. I have a table in Grafana that shows this table data.

2 Likes

Thanks for the input, y'all. It sounds like InfluxDB is worth a shot, at least in parallel with the MySQL database. I'm already looking forward to checking out all of the good stuff here and in other posts on the subject. :nerd_face:

1 Like

With the new Maker API POST Url change, I'm going to redesign my NodeRed flow to take advantage of it. I'll post the new flow when I get it done.

3 Likes

I really appreciate the HE team upgrading the Maker Api for better "bidirectional" support. Being able to selectively push out data rather than having to use the floodgate approach of websocket (PLEASE do not remove btw) is an awesome option. I dabbled with the new Maker Api on my dev hub during the beta and was very impressed with how well it worked. It was only for a few devices as a test but I look forward to using on my main hub and seeing how it holds up.

I also really look forward to how you approach utilizing this as you are my NR/database guru.
Show us the way oh wise one.:bowing_man:

1 Like