Hubitat CPU Optimisations needed?

Hi Hubitat crew, I’ve been chewing on this for quite a long time, but without access to low level processes, it’s been impossible to prove with hard data.

So here are my long term observations and my thoughts on possible options to improve Hubitat responsiveness generally.

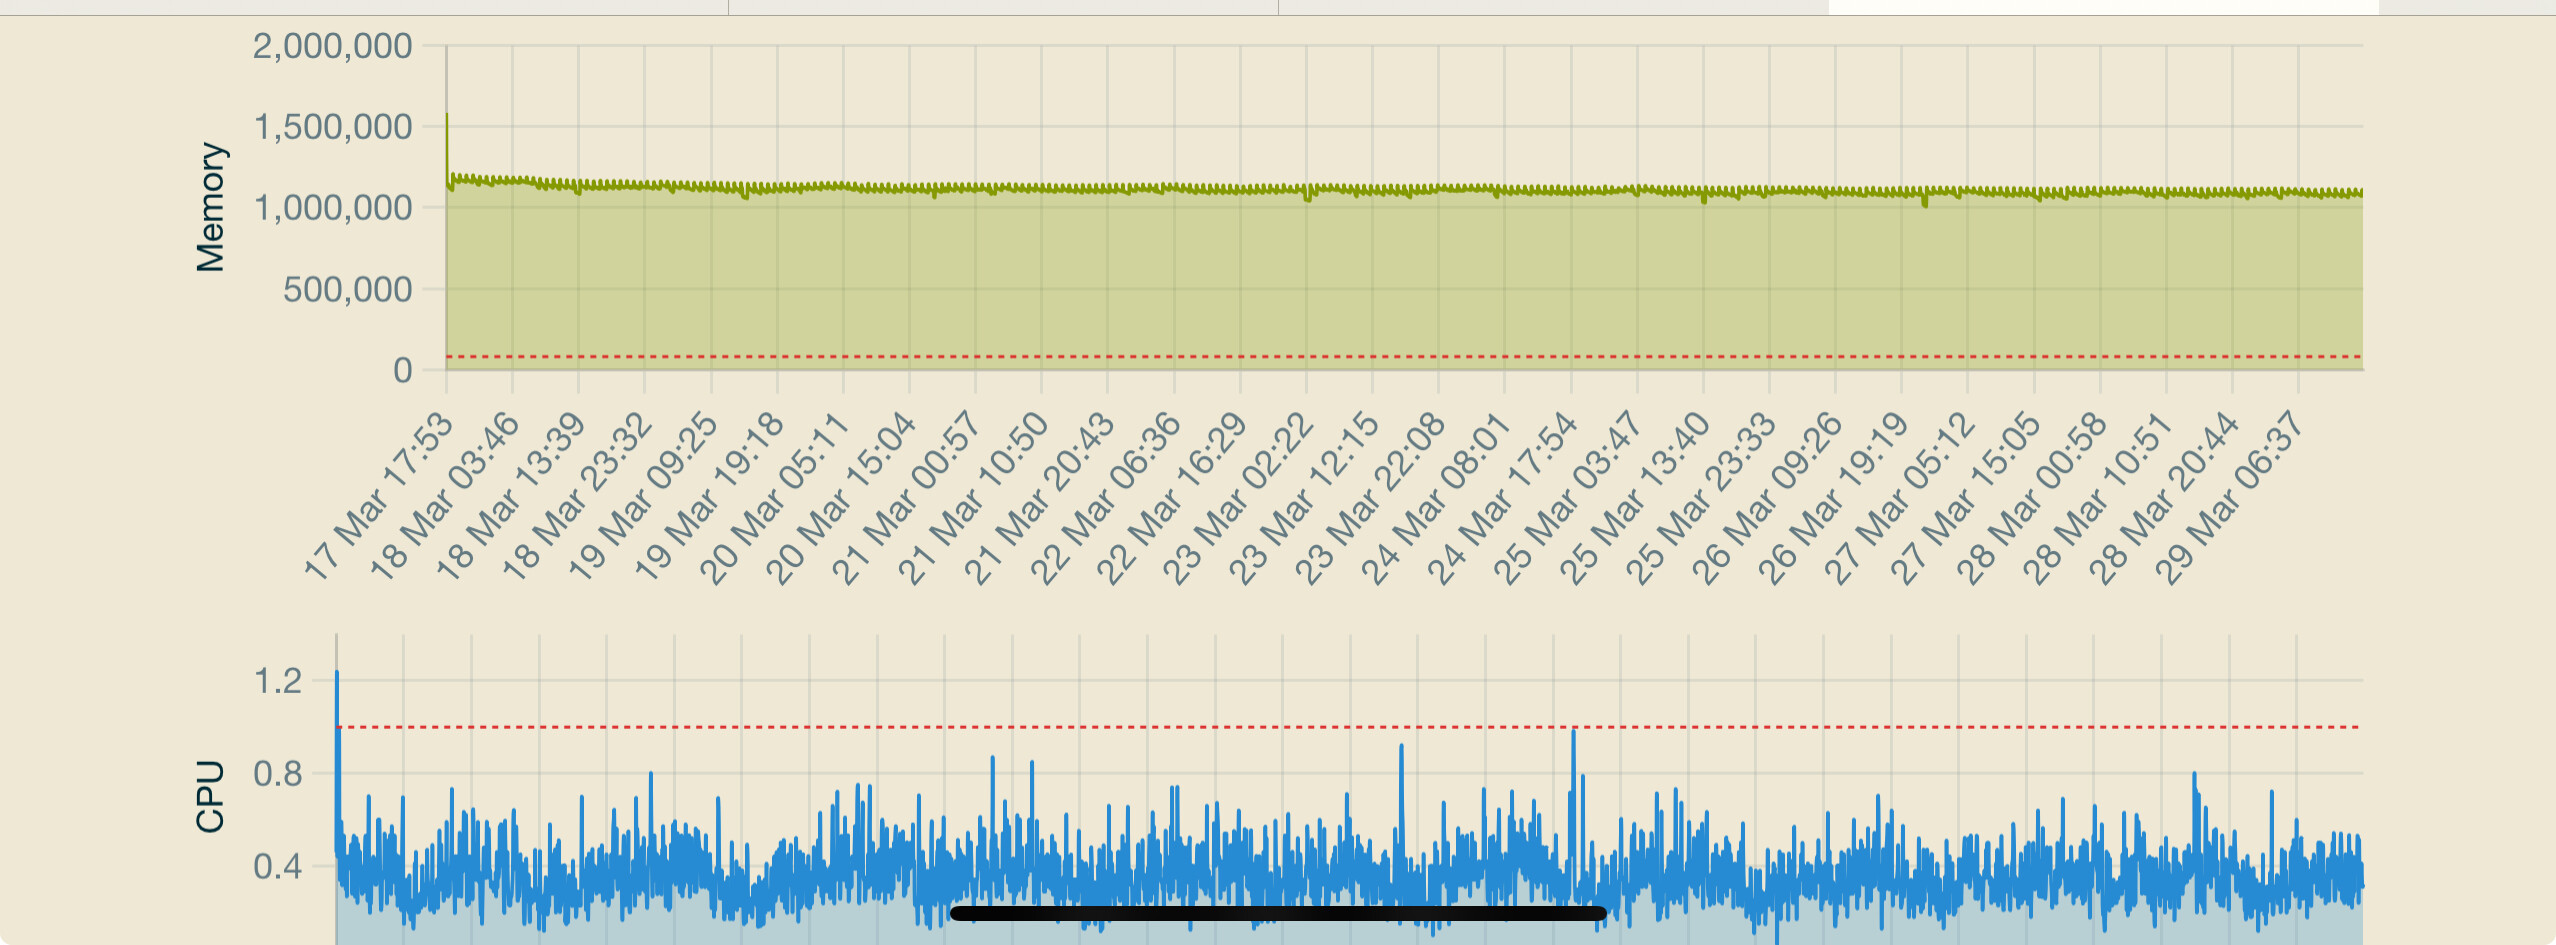
Problem Statement: I’ve found, that Despite not using even close to maximum CPU resources consistently, it’s possible for my Hubitat hubs to miss radio and hub mesh events.

I’ve noticed this since the C7 and can reproduce it on the C8 Pro too. The easiest way to do this is to connect something up, eg Home Assistant, to the Maker API and enable Post device events.

The most common scenario I found was missed zwave motion events. I would notice several per day at random times. I also noticed occasional automatons based on lights turning on failing to be triggered.

The 2nd scenario involved Hue lights connected via hub mesh (using the official hue integration) from my secondary hub. This was much less common tho.

Once I disconnected HA from my C8 Pro and deleted Hubitat Maker API, I haven’t had a single missed event in the last 2 days and the CPU usage patterns have barely changed.

Recommendation: I propose, and I realise i have zero knowledge of the Hubitat inner workings, that Hubitat Elevation uses the Quad Core SoC’s more strategically.

By this I mean assign a priority CPU core to the radios (if they are enabled), a priority CPU core to the HE operating system and then configure the remaining two cores to run user level processes.

Or choose a similar strategy that ensures the core OS and radios always have priority - like I said, I don’t know the current underlying thread prioritisation model.

@bobbyD @mike.maxwell @hubitrep

4 Likes

I think you might have tagged me by mistake? (not Hubitat crew)

But since you did: without knowledge of the inner workings of the platform (as you acknowledged), it might be more helpful, IMO, to describe the problem you observe as thoroughly as possible and figure out ways to make it reproducible rather than proposing specific solutions like processor affinity settings.

Generally speaking, as I have no knowledge of HE's platform specifics: such a solution is inherently complex and rests on major underlying assumptions. One such assumption is that there are CPU-bound processes on the hub—something your own graph doesn't provide evidence for - and those may or may not benefit from such a strategy. There can be many other reasons why the hub might "miss" something that processor affinity won't address, and many ways in which what you propose could make overall performance worse.

3 Likes

I assumed by your recent posts and user name that you work for Hubitat. :man_shrugging:

I can’t provide more evidence without great difficulty. All I can provide are my observations that appear to show that events from the Radio’s and hub mesh can be missed if the CPU loads up too much in that moment, despite overall loads being well below 80% most of the time.

If I remove the source of the extra CPU work, the issue goes away.

My point is that with a more strategic CPU core prioritisation strategy for core components like the radios and OS background processes, this scenario could be close to impossible.

The symptoms suggest Hubitat elevation is using a very general approach to managing threads across the four CPU cores, rather than say dedicating a core to critical processes etc.

I specialise in IT problem management, and data is king, but I don’t have access to enough to do more that provide my observations and thoughts.

3 Likes

That is true... But

I tend to agree that is can be, generally, more helpful to offer up the symptoms and open the discussion up for solutions... Probably making more of this than I should, and move focus back to what you have reported, which does seem quite compelling from what you have described.... I am also starting to sound a little pretentious... :slight_smile:

2 Likes

I did state the problem and how to replicate it.

It isn’t an issue for me as I have two hubs and share the workload across them.

Tbh I was surprised I could replicate this on my C8 Pro, but I can. It can impact both RM and other first party Hubitat apps like Room Lighting etc.

My minor quibble isn't worth pursuing (mostly the topic title).... interesting that you can consistently reproduce the issue.... Hopefully one that the engineers can also reproduce and identify a solution.

3 Likes

my 2¢....
first to demonstrate my age, one of the first control systems that I worked on as a process control engineer was a computer that was originally developed by an electrical equipment company to control high speed compressors. Given that this was before microprocessors, the CPU was quite limited in power so everything it did was based on a strict priority scheme. They could not afford to miss an event. They gave up on using computers, but chemical and refinery processes weren't so fast so we used them.
Later on realtime minicomputers also used a similar scheme, DEC, DG, and others.
My thoughts are that assigning CPUs to specific tasks is a blunt force approach. Higher piorities for specific system tasks, then data transfer for control purposes, then control tasks, then orher data management tasks and then finally UI tasks would be a better prioritization scheme. Probably could be improved by those more knowledgeable than me.
There is no way that a data transfer process should affect a system task, like radios.

1 Like

I think there are a few things to remember with this discussion.

First is that we don't have anywhere near the whole picture as to what is happening on the hub. The CPU measurements we capture are over a 5 min interval and are the load values for the system.

To simplify the understanding the Load value has been converted in a way to CPU usage, but it isn't a 100% accurate representation. The Load value is a estimate of needed resources based on the tasks taking place and how they are performing. Generally speaking, you probably want them as close to 1:1 as possible with CPU cores, but there are certain conditions that may not be applicable. For one example Storage IO performance can create a condition where a high load value is complete acceptable.

The fact that the Load values are taken over 5 min intervales leaves allot of times for spikes. Think of it like this, you may have a Load value of .1 over a five min interval, but of that time you could of had 1 min where the load was a value 8 and the rest of the time it was hardly doing anything. In that 1 min is when bad things could happen, but it would never look problematic based on the load value.

This is why I am always worried about scheduled jobs. I even took extra steps to randomize times for jobs in software and drivers so they don't fall on set min values.

Second last time i checked, even the values we get are not really accurate for app or driver stats either. When you look at device and app stats there are certain conditions that can create elevated numbers there for process time. This is related to how the time is calculated based on process time stuck in a routine in those apps/drivers.

Lastly there are ways to prioritize jobs without setting up processor affinity. Processor affinity has it's pros and cons. Processor affinity not only ensure 1 core is available to the given job pool, but also can limits it that as well. There may be times you need more then 1 core to do the work the system needs, or simply the ability to run multiple threads at the same time can dramatically improve performance.

My role for a few years when i was working on a IBM i system was largely performance analysis and Work load management. I ended up implementing something from IBM called workload capping. Basically it was a way to limit the number of cores a pool of jobs could use. It didn't limit the system processes just those jobs in a subsystem we assigned the WLC to. It worked well when you had enough cores, but when you only had a few cores it was difficult to implement. The biggest challenge with it was deciding what the priority of the jobs where.

Either way as said earlier data is key to really getting to the bottom of this and we don't have enough to really speak to it. You really need profilers to look at the apps involved and the ability to look at continuous performance metrics at very small intervales. Going back to that IBM i when we had a issue i would first look at 1 min intervals to see a trend and then would promptly go down to 5 second performance intervales to look for the culprits of what was cuasing issues. Almost always we needed to look at the 5 second intervals to really see what was taking the CPU, causing wait states, ect.

4 Likes

The experiment you performed indicates that the problem is probably not a lack of CPU power, but rather that Maker has a critical region in the code that has interrupts or event processing disabled, causing something to be dropped.

Unfortunate that you made two changes (disconnected HA and deleted Maker), making it difficult to identify which is the cause.

You don't say how you have HA being brought into your C-8 Pro. Is it through HADB or instead through Maker?

I would suggest that you try bringing HA into your C-8 Pro through HADB so as to change the experiment to see whether Maker is the cause. I use HADB, not Maker, and have never seen what you are experiencing. I believe that the results of this experiment would give the Hubitat staff something concrete to examine.

2 Likes

Not easy to draw conclusions on CPU load from interpretations of a process that runs in a JVM.

5 Likes

HADB is for HA Devices >> Hubitat

The Maker API integration mentioned is probably the HACS plugin which uses Maker API to bring Hubitat Devices >> Home Assistant.

3 Likes

The problem statement is not clear to me, except that events are missed.

Also, I believe that Maker API was one of the original apps, and has not been examined/changed in a long time. The handling of events may have subtle issues. Also, because Maker API was added very early, it may have hooks into the underlying JVM that current apps and drivers do not have, due to more mature interface with the underlying system.

I believe I have seen a remark by Bruce that Maker was intended as a quick and dirty implementation to get something up and running as the system evolved.

You can replicate it, but it may be difficult for staff (or others) to replicate that setup. Plus the occurence appears to be random, not systematic.

I get it. It may be difficult or impossible to create a test scenario that is easily and systematically reproducible in any environment, not just yours, but if it is possible, it can really help.

One problem is that it isn't necessary just HADB or Maker API being installed that is the problem. How they are configured matters quite a bit as to the load they can product. Something polling a Maker API endpoint for lots of devices will produce significantly different load on the hub.

We need to see how you were using HADB and Maker API to help diagnose the problem(s).

I use both on a C-7 that is dedicated to 'net' style integrations, bringing a collection of devices to/from an HA instance. That C-67 shares a collection of devices with my main C-7 via Hubmesh. I am not seeing the problem in the OP.

Not sure what you expect from staff, but this is big goose egg. Getting my attention just because I'm sitting around.

Yes, it is an early app, but it is looked at regularly as issues arise.

Nope, nothing special there. It just subscribes to events like any other app.

No, Maker API has no 'critical' region of code, and doesn't disable event processing or anything of that ilk. Without the "great difficulty" undertaken, we won't know anything beyond your uninformed musings. I can conclusively state that CPU optimizations is a total red herring, and CPU utilization has no bearing on what you are observing. You haven't even documented in any meaningful way "missed wave motion events". Missed by whom? Are they in the logs? Come on, this is ridiculous.

2 Likes

You are 100% correct that this is the most common strategy. One reason I suggested a segmented core option is that I’ve seen discussions on different strategies being used with recent multi-core arm CPU’s with big-little architectures.

Apparently apple effectively (I’m over simplifying) reserves a pair of efficiency cores for the OS background processes on the ARM CPU’s, which leads to a very smooth user experience, even when the system is under very high loads.

That said, I don’t mind what the answer is, as long as the end goal is met of HE not missing events.

You raise excellent points, I definitely don’t have the answers and would really love for the Senior Hubitat team members to weigh in.

Ps, what is this IBMi you speak of? Surely you mean AS/400? :wink:

1 Like

I have a second Hub (c7) that runs most of my LAN / Cloud integrations and provides the devices to my Primary C8 Pro hub. This issue is actually why I got a second hub a few years ago in the first place.

I pull in a small number of devices via HADB and share a large number of devices back to HA via the Hubitat Maker API for use in dashboards. I don’t run many automations on my Secondary hub, 90% of them are run on my Primary Hub.

As mentioned earlier, this was an experiment to see if the C8 Pro, like the C7 and C8, was susceptible to missing events if loaded up via the Maker API.

Your point that the Maker API could be the issue is certainly possible, however I don’t think it is the culprit. I bought a second hub years ago because I was seeing this issue and someone on the forums suggested a second hub for LAN / Cloud Integrations would resolve the issue (they were correct).

True on both counts.

Good point, I had about 40 zwave / zigbee devices being shared to HA with control enabled.