Hi,
Could someone point me in the right direction, I am very new to Hubigraphs and not sure what I am doing, but want to give it a go. I have my greenhouse temperature tracked with a green line and also when the fan turns on in blue to cool it down on hot days to monitor it's effectiveness. The issue is the tracked temperature will only span to the previous 24 hours while I have selected a full week for both items. The fan and the temperature setting are the same in the setup so i expected bot to span the same time. I am thinking its something to do with the number of points it's recording. Not sure how to fix this. Probably something simple I am missing, any takers?
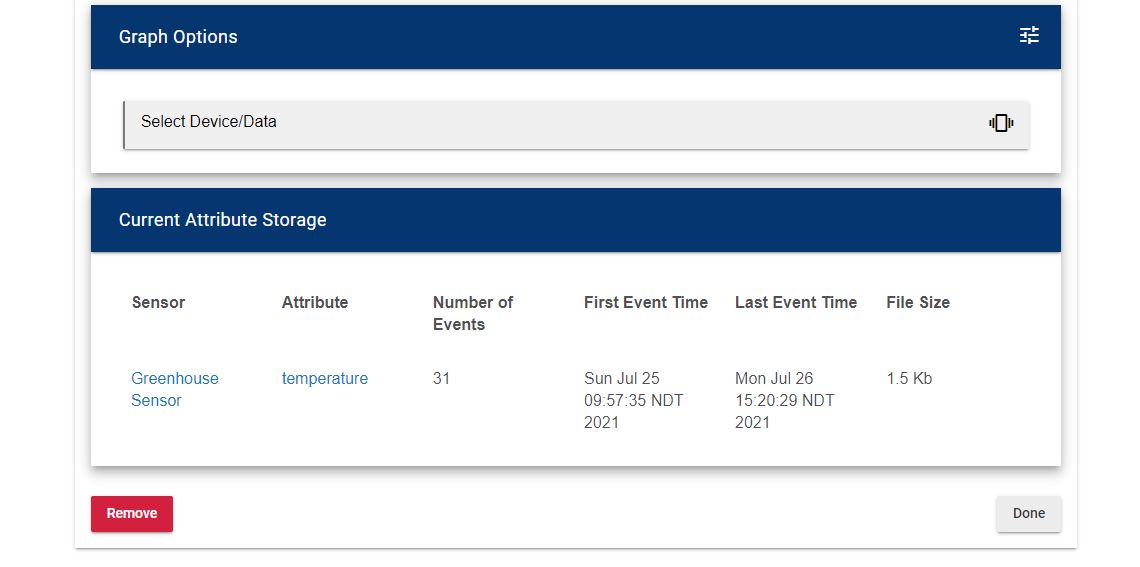
Have you set up 'Long Term Storage' (LTS) for the devices you want to use. If you want a week, select a week for the devices in LTS.
If you haven't, set the devices in LTS and then go back into the graph. You will then find a toggle for using LTS on your graph.
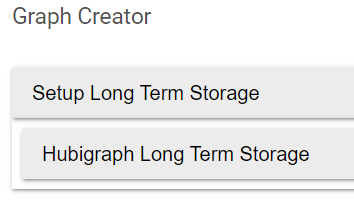
Ok, that must be what I am missing. I can't find this LTS in any of the setup for the graph (or is this somewhere completely different) Where would I find it?
It's at the top when you go into Hubigraghs.
When done you the see LTS under the setup option.
Awesome, I did not set that up so it has to be the issue. Thanks for the help!!!
1 Like
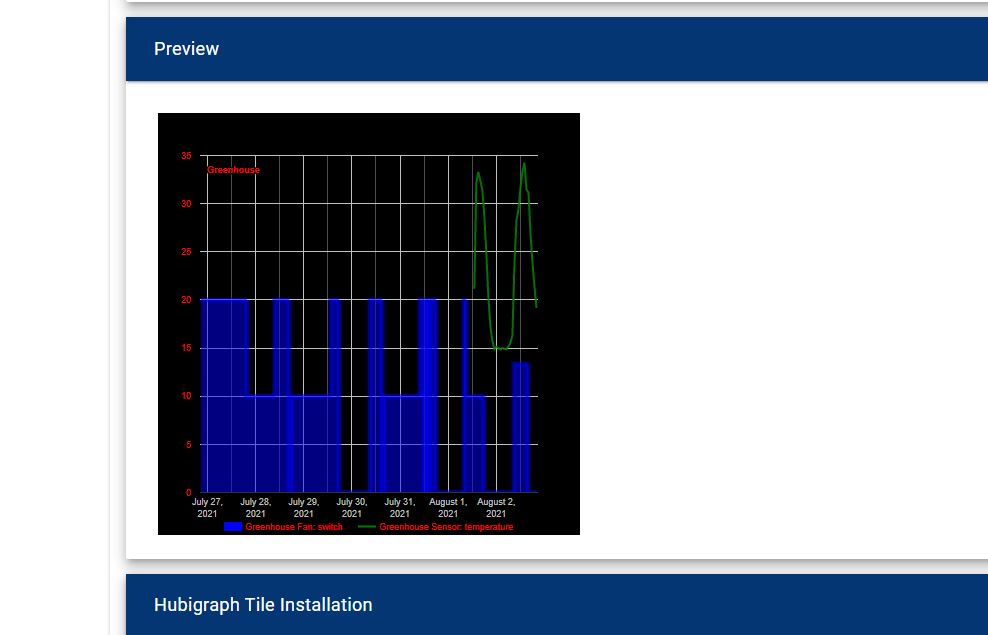
So like this... It only is going back to yesterday, but i assume it's because of a new setup?
That's correct. It will gradually populate through the week as the events write to the file.
If you go to settings -> File Manager you can see the file for the device.
1 Like
Ahhh got it. Makes perfect sense. Thanks.
1 Like
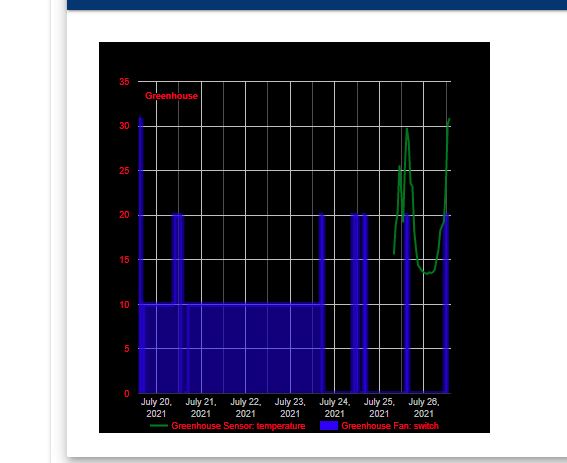
Hi 
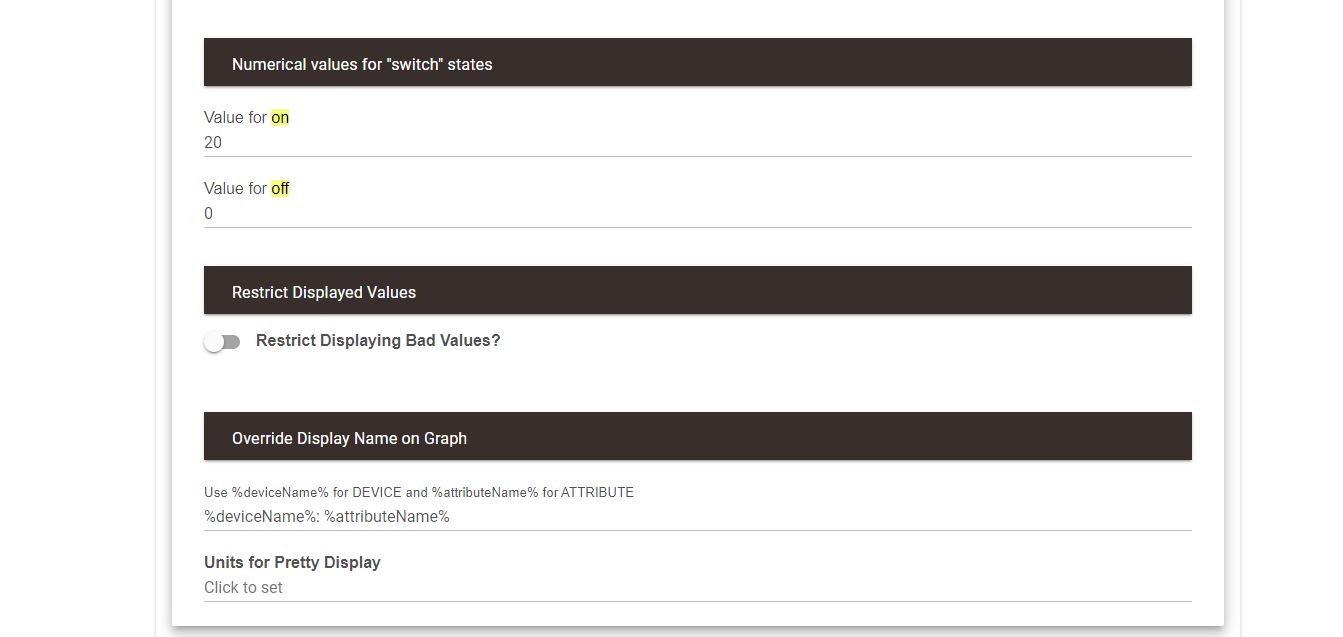
My graph is working with the LTS now, all good (the following picture it's cut off due to sensor replacement) But I do have another question regarding my fan on and off. So I set the value for on to be 20, and off to be 0, however sometimes I get in between numbers, how is that possible and any idea how is it fixed?