I guessed the Legacy App was just that. But you threw me off when you said 2 apps and 1 driver.
Thanks for clearing that up.
I guessed the Legacy App was just that. But you threw me off when you said 2 apps and 1 driver.
Thanks for clearing that up.
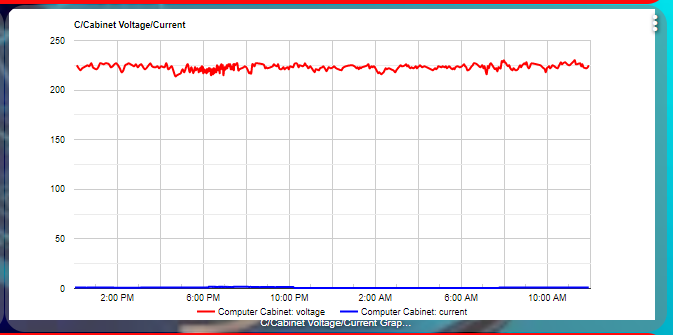
Hi, thanks for the continued efforts you and your son are putting into this, I am really enjoying setting these up. What I wanted to ask is if I am "graphing" 2 attributes which have a vastly different scale, could it not "just asking" have values (Y) on both sides of the graph and have one scale for the one attribute and another for the 2nd attribute ( hope this makes sense). I know this would limit the graph to 2 attributes but it might be something people would use.
Here is a YouTube video of what I am asking YouTube
Here is my current graph of Voltage and Current
Great Work! In my short foray into Home Assistant, they had the ability to do the timeline graphs of devices that I loved but I could never figure out a way to do it with Hubitat. Now you did.
I use Node Red and I bet there is a way to use Node Red and Google Charts to recreate this. I found a Google Charts palette but it loads w/ an error so I am going to have to find a different way. This has inspired me to go down the rabbit hole of Google Charts. Thank you.
I'm moved. Your app is really fantastic, and so easy and intuitive to operate!
When I set background to transparent the graph pops up as white. Is it the expected way?
@thomas.c.howard Still all good. No more lock ups. Getting used to the slow initial load time. All quite fine with me. 
@thomas.c.howard Wow, Really fantastic work. Able to install in a snap.
Thanks for the app. I really mean it.
Thanks and regards,
Pugazhendhi M
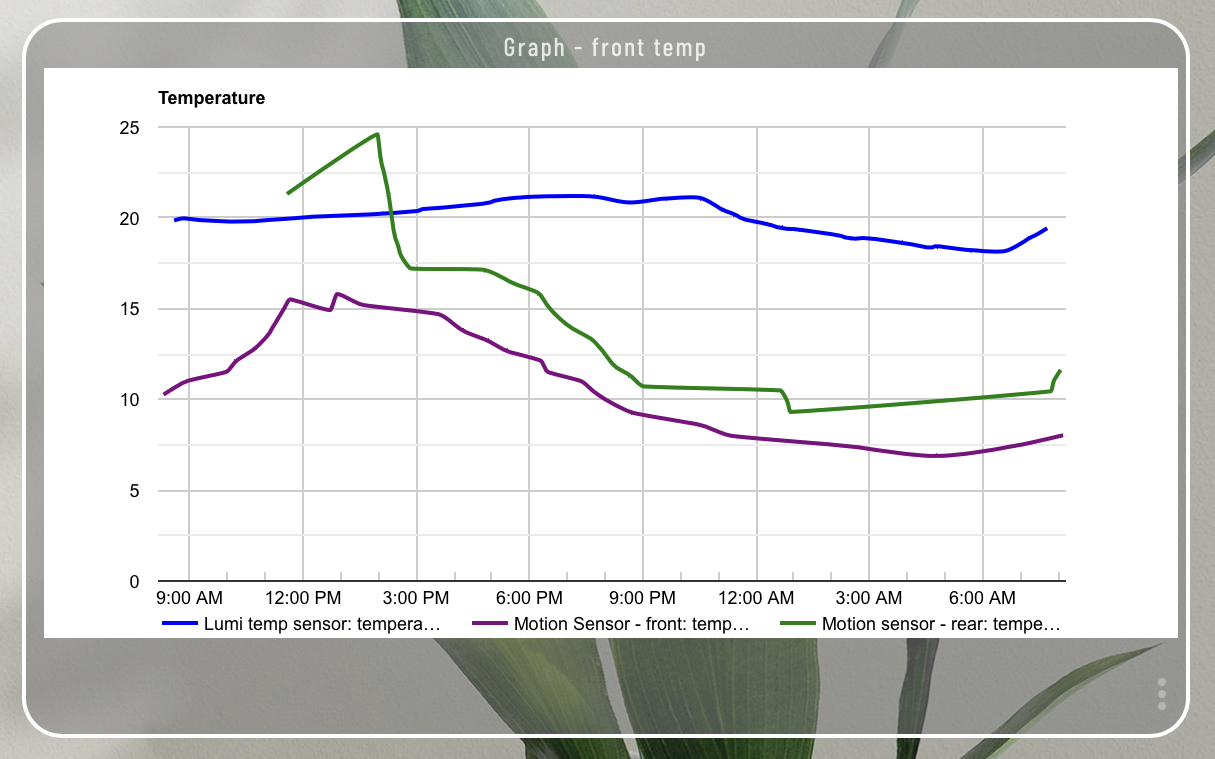
Hi tried to access my hub this morning and was able to ping the hub but no web access this is the error I received, this is the first time since I have had the hub that I have been unable to access it via the gui. Not saying what caused it but this is what I found in the log. App 4 is the Hubitat Dashboard.
app:4 2020-05-06 04:10:59.858 errororg.h2.jdbc.JdbcSQLException: The database has been closed [90098-197] on line 626 (dashboardDevices2)
app:4 2020-05-06 04:10:36.112 errororg.h2.jdbc.JdbcSQLException: Out of memory.; SQL statement:
SELECT C.ID AS CAPID, C.NAME AS CAPNAME, A.ID AS ATTRID, A.NAME AS ATTRNAME, COM.ID AS COMID, COM.NAME AS COMNAME
FROM CAPABILITY C
JOIN DEVICE_TYPE_CAPABILITY_LINK DTCL ON DTCL.CAPABILITY_ID = C.ID
LEFT JOIN ATTRIBUTE A ON A.CAPABILITY_ID = C.ID
LEFT JOIN COMMAND COM ON COM.CAPABILITY_ID = C.ID
WHERE DTCL.DEVICE_TYPE_ID = ?
ORDER BY C.ID, A.ID, COM.ID [90108-197] on line 626 (dashboardDevices2)
app:4 2020-05-06 03:53:33.071 errororg.h2.jdbc.JdbcSQLException: The database has been closed [90098-197] on line 626 (dashboardDevices2)
app:4 2020-05-06 03:24:49.604 errororg.h2.jdbc.JdbcSQLException: This CLOB or BLOB reference timed out: "16309545/-3" [90039-197] on line 625 (dashboardDevices2)
What is app 4?
Which version are you running? Also, did you reload/refresh your browser automatically? Here’s the thing, once the graph is loaded, using the latest code, there are zero hub calls. All the graph does is listen to the endpoint via JavaScript. The only time there is hub interaction is when the graph is first loaded or the webpage is refreshed.
I am running the latest version 0.61, as I say it has never done this before, I though maybe someone would be able to tell what the error could be, I did see it say "Out of memory"
What is app 4? Click on it in the log and it will highlight it in the log above.
Hi SmartHomePrimer
Sorry I did say what is was in the original post App 4 is the Hubitat Dashboard. That is what is showed when I clicked on App 4 in the logs.
Then it wouldn’t have anything to do with HubiGraph. The Dashboard is just displaying the URL from HubiGraph via the html attribute of the devices you created for it. Only thing you should ever see from it in the Dashboard is the URL result, or an error on the Dashboard tile. There isn’t a way for it to make the Dashboard itself unresponsive without making the entire system UI unresponsive.
Hi SmartHomePrimer
I did not say it was HubiGraph, just said that is the only app I have added in awhile and it was the first time I have had to pull the power on the hub, could ping it but not able to login to the ui at all. I am hoping it is not HubiGraph as I am really enjoying the app.
Did you try the hub on http://hubip:8081 too? If not next time try it before pulling the plug. 
Very wise words.
Absolutely Fantastic app!
I've done a quick hack to add presence sensors to the timeline (and a pull request).
Version 0.7 Alpha is Ready. This one adds greater axis controls. See top post for details.
@thomas.c.howard nice one! Works well!
A small request... if one is only graphing data against one set of data points (so only one axis is being used), could you repeat the axis labels onto the opposite side? Axis points only appear on one side.
This is really shaping up to become a powerful application for HE!
Cheers!
Download the Hubitat app