Ah, I missed that! Adding the key to the main app now let the Weather Tile 2 work. Thanks!
This is a beautiful app! I wish there was a way to clone a Tile though - our current weather Dashboard has a forecast tile for each day of the week, which I'd much prefer to have generated via "Create Today+1, then copy and edit to Today+2, etc.".
I am running an Amazon fire tablet 8 with Fully Kiosk. I have Fully Kiosk bring up a Hubipanel page. The radar is on one of the HE dashboards contained in the Hubipanel and the error happens regardless of which dashboard is open on the Hubipanel. It doesn’t happen all the time but seems to most often over night. I suspect it has something to do with HE nightly clean up but can’t confirm that. I have yet to see any error in the logs.
Great App, I managed to get OpenWeather to re-enable my account and I have now got the Forecast Tile working. Some issues for consideration though.
When I double click a tile in the Edge Browser I get the options box, but when I use Firefox, my preferred browser, double clicking doesn't work.
My update rate is set to Half Hour, but when I check the Logs ("Open Weather Child Device") it is polling every 10 minutes.
Under General Options, when I change the Background Color, nothing changes. I would have expected the black background to change to whatever I have set.
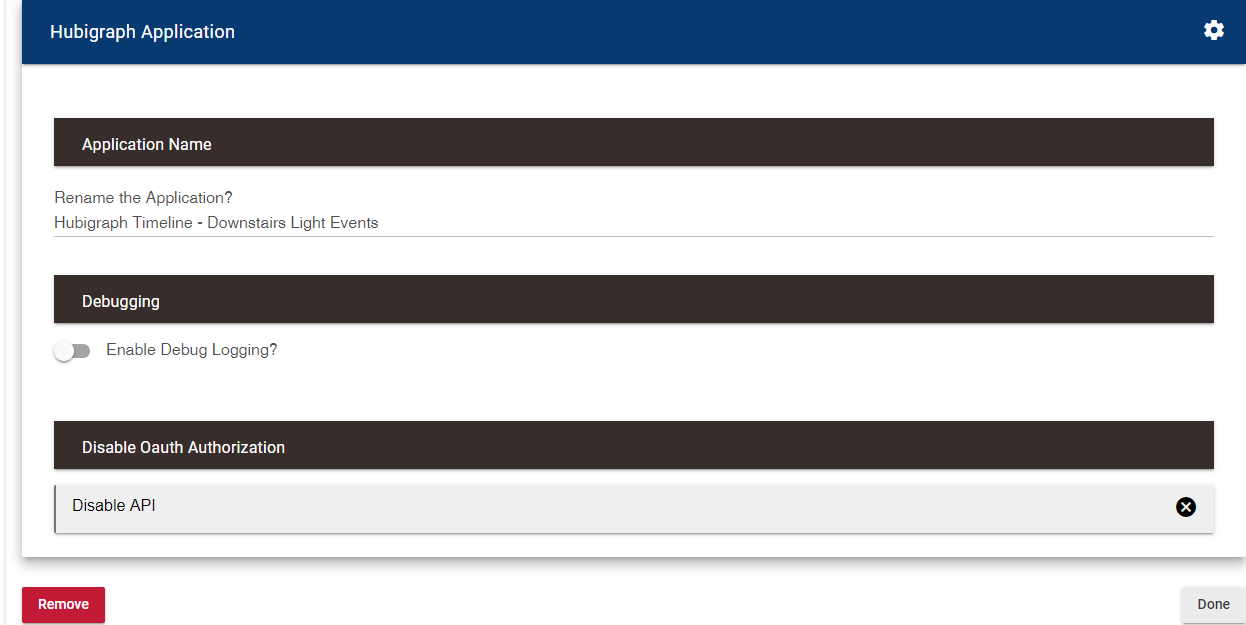
I’ve noticed today that the Hubigraph app loggs debug data in the logs, but I can’t seem to find where to disable it... Can the debug logging be disabled? Thanks!
Each of the individual apps has a debug logging feature. Go to Hubigraph Timeline - Downstairs Light Events, and you'll see the debug logging near the bottom. The same thing for the rest of them.
I suspect there is something in the code that should have been removed, but was forgotten...? The good thing is that the information only appears in the log when the app is run.
Yes, there are some random debug logs still enabled in various places. Those only appear when you're in the app pages. I have a random debug '2' that appears from my range bar, every half-hour or so, from the buildData() code. Maybe I'll remove it some day...
I am wondering if there is a way to show a horizontal line the whole width of the graph for those min and max values?
I have used the time graph feature to graph the result of a humidity sensor which provides a max and min value. For now, I just graph the values, but it isn’t working so well...
Thanks for this app. I'm having a great time playing with various charts. I've been dreaming of a heatmap of my devices status for years (searching for that is how I found HubiGraphs).
I found a couple of really minor defects: in heatmaps> annotations, the decimal place control always returns to 1 and the Italics control doesn't work.
Unfortunately, the gauge is a simple implementation of the Google gauge. Therefore, that is all that is available... I have been looking at moving away from google charts, but my computer is down; so no updates until that is fixed....
Great work here! I am a noob here - 3 days. Smartthings refugee. I've installed package manager and installed Hubigraphs with no issue. Created a new Weather tile, it shows up fine in the app creator. Created the tile device as well, shows up in devices. BUT after reading everything I cannot for the life of me figure out how to get it onto my dashboard. It seems when I add a device tile I have to pick a preexisting template and none are "Hubigraph" or anything else that works. Can you please solve this one tiny but major riddle.