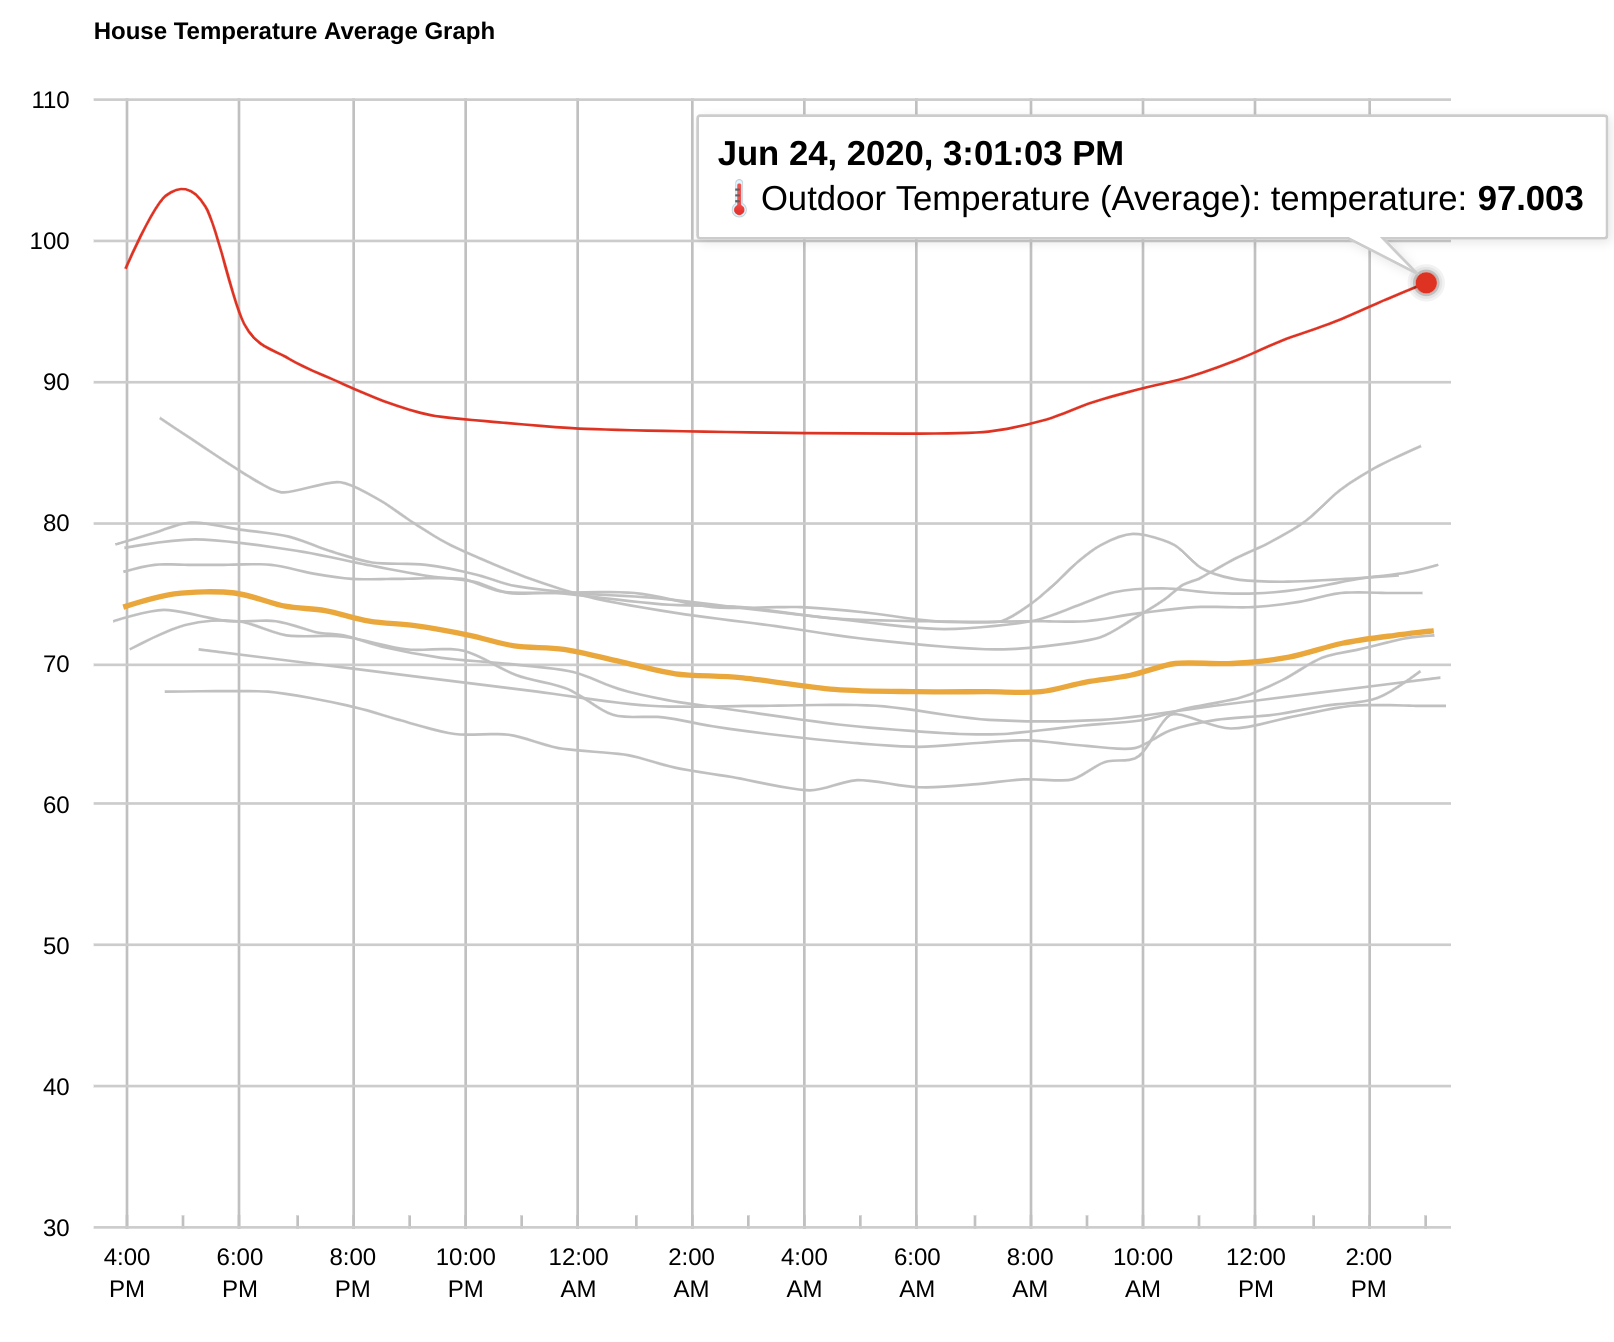
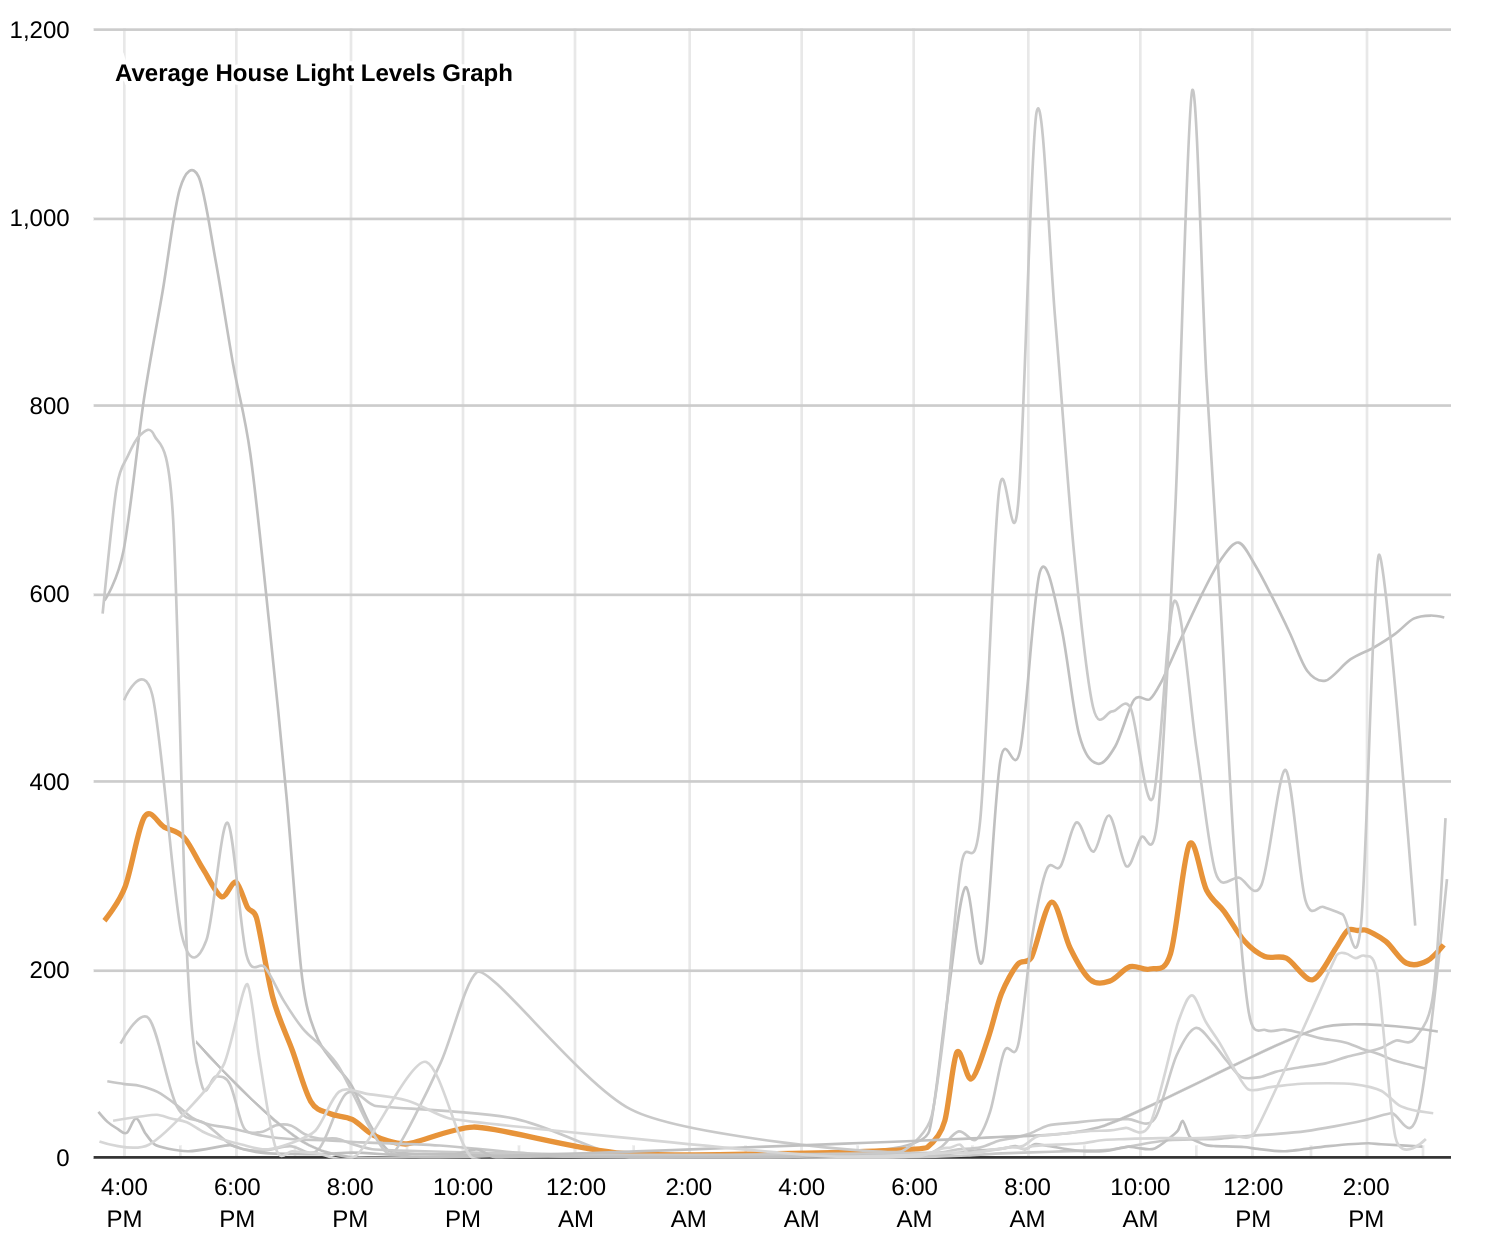
Another small thing... would be nice to be able to specify a particular device/line as being "topmost" (like my average lines) so that other lines don't draw on top of them.
I’ll take a look... wife’s bugs take priority though (she wants transparency on the bar graphs)...
3 Likes
Wondering if anyone might have a solution to my problem.
I can't seem to get my Graph tiles in the Dashboard to show anything other than blank grey on my Chromebook. It is an older one so it stopped getting updates as of Chrome OS v 76 if that has anything to do with it.
Only the tiles don't work on the Chromebook. If I use the direct URL link the graphs are as expected. If I go to the dashboard on my Android via the Hubitat app everything is fine. If I use Firefox on my phone it is fine for local links, but grey box for cloud links. The Chromebook seems to be using the local link as it has the hub IP address/dashboards in the address bar.
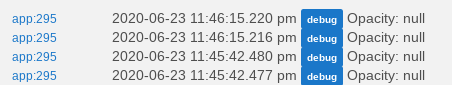
Only thing I see is some repeated debug notes from the child app (I'm running version 1.76)
Some incompatibility with that version of Chrome OS or something I'm doing wrong?
Go back into the graph options for your lines and change something. Opacity was added in 1.76 but it has no value for it.
@dtbrewer, @jared.zimmerman: Version 1.80 is released. It has slider fixes so there is much less lag. Also, I fixed the line thickness issue. Please go back into the "Device Selection and Graph Configuration" pages so new values get populated. Your "old" settings should still be valid. Let me know if you see anything I missed.
2 Likes
New Bug, vertical axis line color isn't actually working, I'd tried to lighten them up by setting them both to custom color 245,245,245 and the vertical still looked like the standard grey, so I set it to pink, and its still default grey, looks like it just is ignoring color selection all together.
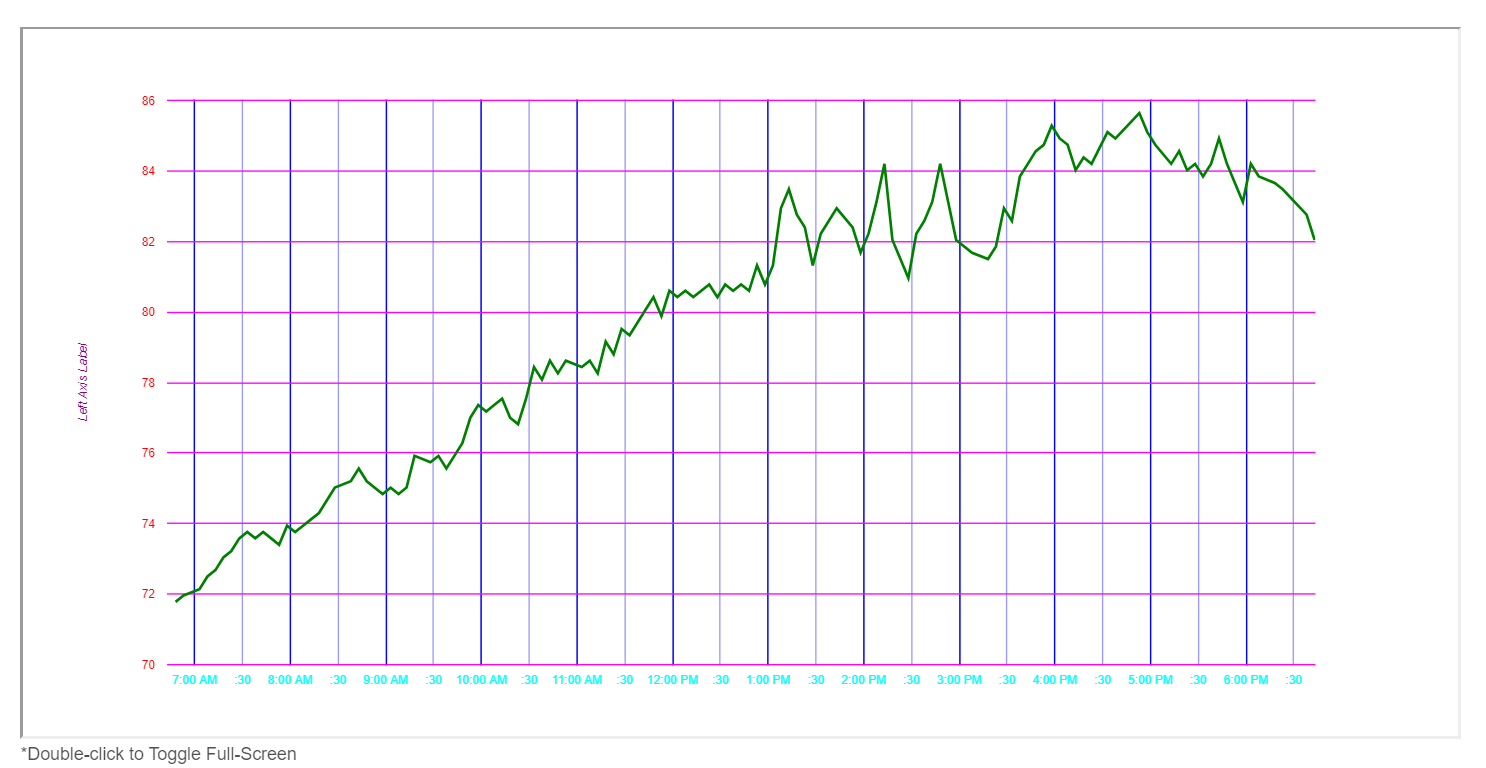
that's...colorful
Nice colors!
So I'm wondering about the height of the graphs. I have the size set to auto-fit, but the actual iframe height seems to always be set to 150px in Firefox (v77.0.1 on Linux). The height re-sizes in Chrome, and also in Fully Kiosk Browser.
This happens to me with the range graph as well as the gauge graph. I'm not sure about all of the others.
I can't quite figure out why this is so. I was looking at the CSS in Web Developer but couldn't figure out why it's happening. Not sure if you have any ideas?
@albertsmark, @TechMedX, @BrianP and all other FireFox users.
To use firefox with the tiles:
- Don't use Firefox.

- If you do, add the following to the CSS section of your Dashboard (under Advanced)
.tile-primary{
height:100%;
}
1 Like
@thomas.c.howard That should work but you need to add the tile ID number to target the tile, or it will change all the tiles on that dashboard. One may need to add the '.tile-contents' attribute as well if you use smartly (not 100% sure otherwise). Sorry I thought that was already known. Here is my code, change the tile # to your tile #.
#tile-30 .tile-primary, #tile-30 .tile-contents{
   height: 100% ;
}
We are going to be targeting your "Graph" attribute to set this automatically in smartly. We are working with other devs to customize their attributes to stand out to smartly for easier targeting of corrections such as this.
Example @bptworld added the 'bpt-' before his attributes. If you ever wanted to do the same let us know (or keep using just Graph) and we can focus corrections that way in the future.
1 Like
@TechMedX, agreed with everything you said. I tried the change on a few of my dashboards without seeing a negative effect, to the point that it looked like an omission -- width was already set by default...
I have reached the point in development where I can entertain other "enhancements". For example, if it would make it easier for Smartly to key off the iframe id, I can easily set/change that. Let me know.
What we target is the attribute in HE
If all you Graphs use "Graph" and need the same adjustments we're fine. If some of your Graphs need separate CSS adjustments then we would need to break them out to target each one separately. Also if someone else decides to use "Graph" and then we have a possible code conflict, then we would add some prefix or something. For now "Graph" is what we are aiming for, so just let us know if we need to change it. (changes not implemented as of yet, but on the road map).
Sounds good. I have worked hard to have a "common" graph definition. Good to know it was worth it. No need to change...
1 Like
Thanks, that helped in Firefox. I used:
.attribute .tile-primary {
  height: 100%;
}
The only attribute classes I have are for HubiGraph tiles on this dashboard, just in case that was a problem for other tiles. I didn't seem to need the .tile-contents height, it was already set to 100% via some other custom CSS.
However, I noticed that the SVG is always at least 150px high, except for the gauge graphs that become smaller if the width is less than 150px (always remain square). I'm not sure why that is set as a floor. For example, if I set the height of a range bar plot to < 150px, it continues off the bottom:
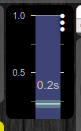
Here the label is outside the bottom of the tile, since it is 114px high and the SVG is at least 150px.
If I make the tile taller, it will grow to match that height. For example:
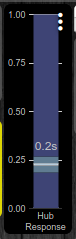
Is it possible to make that 150px not be a minimum value? It doesn't seem to happen for width. It would render at 37px wide with no problem on my dashboard.
BTW, quite an edit to get the negative values working...
Oh, @TechMedX:
Don't forget "Graph_No_Title."
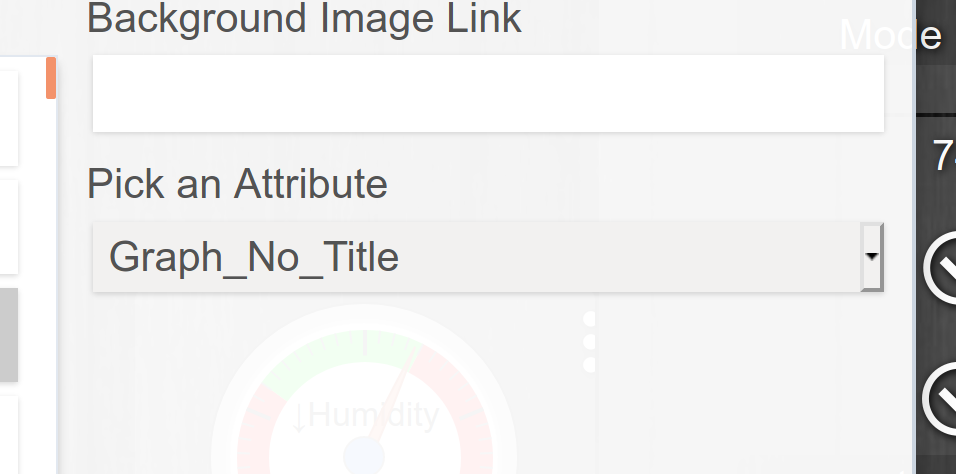
I'm assuming you're looking for Graph.* but if not, don't forget to add it!
Thanks 
1 Like
Actually, Graph_no_Title just “hides” the title on a regular tile. It uses a hacky (but effective) way to modify the underlying html to hide titles specific to the graphs. I believe smartly already provides that ability, and in a more elegant manner.
1 Like
Smartly allows for dynamic name changes of tile titles without editing the device name in HE (very handy feature). It does not blank them out. If you want to display no title I use the following in CSS
#tile-30 .tile-title {
display:none;
}
@BrianP we'll target Graph* so it will pick that up as well.
Hi, firstly, what a great work you have done here! 
So, I'm having an issue while configuring a graph.
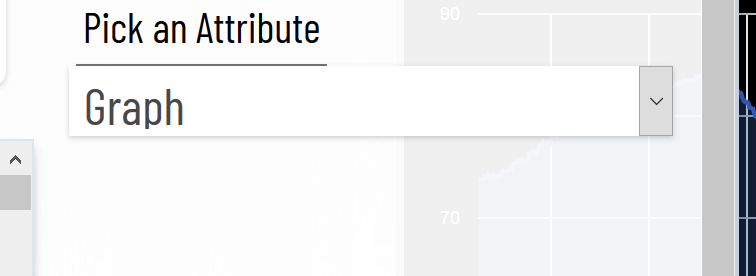
For a Line Graph, I tried to add the "Num Vertical Gridlines", but it appears to not be working, because the number of vertical lines don't change (I tried several numbers). Have you seen this ever happening? Thanks a lot.
Felipe.

