I also didn't get a tile for the Hubigraph Range Bar, either. I haven't looked at that issue, though.
All,
Thanks for taking a look. I’ll get a fix in tonight for the range bar.
thanks thomas.c.howard thats what I had wrong the uppercase G
Range Bar Tile Issue is fixed
1 Like
Did that fix the transparent issue in the Range Bar graphs ?
Which transparent issue?
If I set any of these to transparent they don't work and still use the values they were set too.
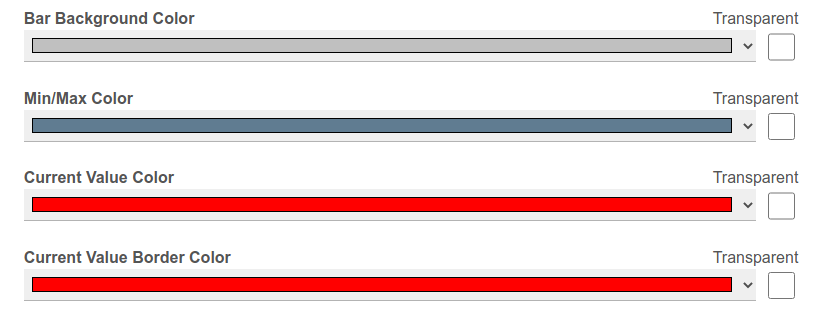
First graph is set to use transparent on everything but current value...
Awesome!!
I'll have to keep fixing that issue to make it work for very small values. I'm not sure if there is some other reason you chose to use a value of 1 for c in the JS, but it definitely works better for me with a float that's small compared to the range.
No reason; just can’t anticipate everyone’s needs. I’ll add it to the list
2 Likes
Whhaat?? Are you sure. ![]()
1 Like
Thanks. The fix fixed it!
Another bug...
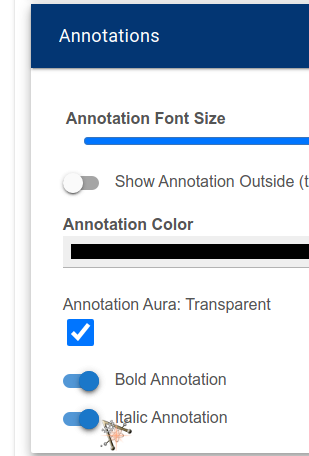
You can't unclick the Italic Annotation -- when you try to it toggles the Bold
Added to the buglist
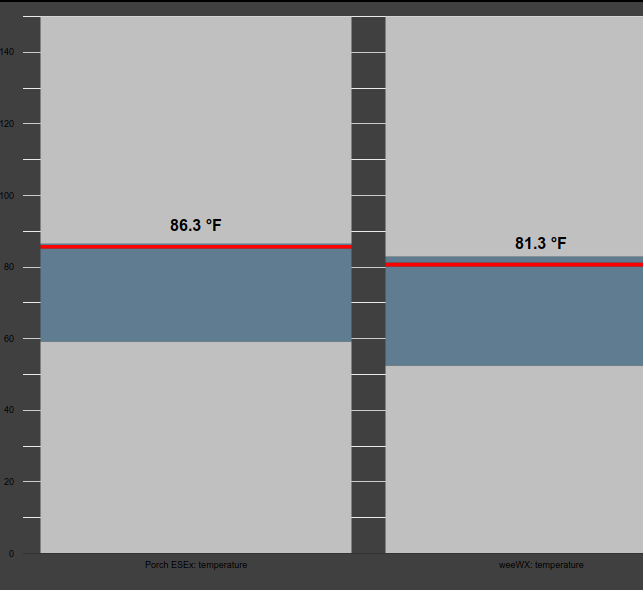
When you set the lower limit of a range graph to a negative number, the graph gets messed up. In the following example, the range is -10 to 60. Note that all the numbers have been shifted up 10. For example, the top bar (Refrigerator temperature) is reading 39.2F but is located near the 50 mark on the axis.

@rsjaffe, I have updated Range Bars to support negative values. It was...fun. Thanks for the screenshots, they helped.
1 Like
I can't seem to change the Timeline Graph Order
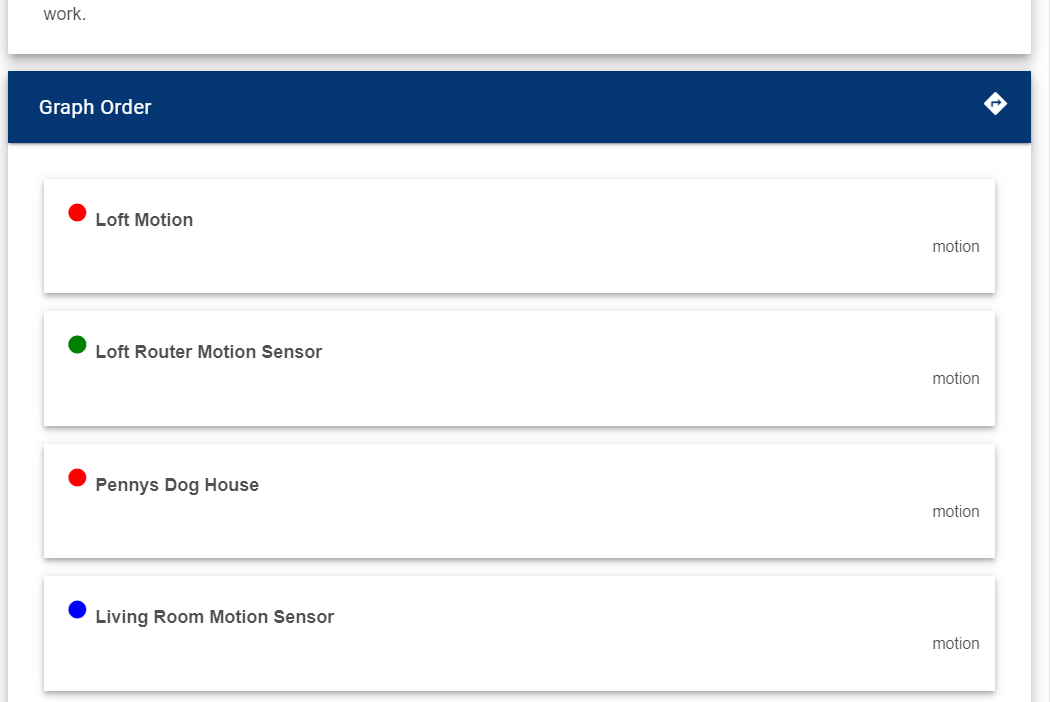
I have the js file in the File Manager
I click on one and try and drag it an it doesn't move, just give me a circle with a slash through it.
Using Chrome, I right click and hit save and that is the size after it saves.

