I realize that Hubigraph is no longer being supported by its creator but I like its incredible utility and flexibility and non-dependency on additional hardware so have attempted to incorporate a Hubigraph in a dashboard to monitor my hub’s CPU load, free memory and DB size. I am hoping some community members that use Hubigraph and the Hub Information Driver can help me out.
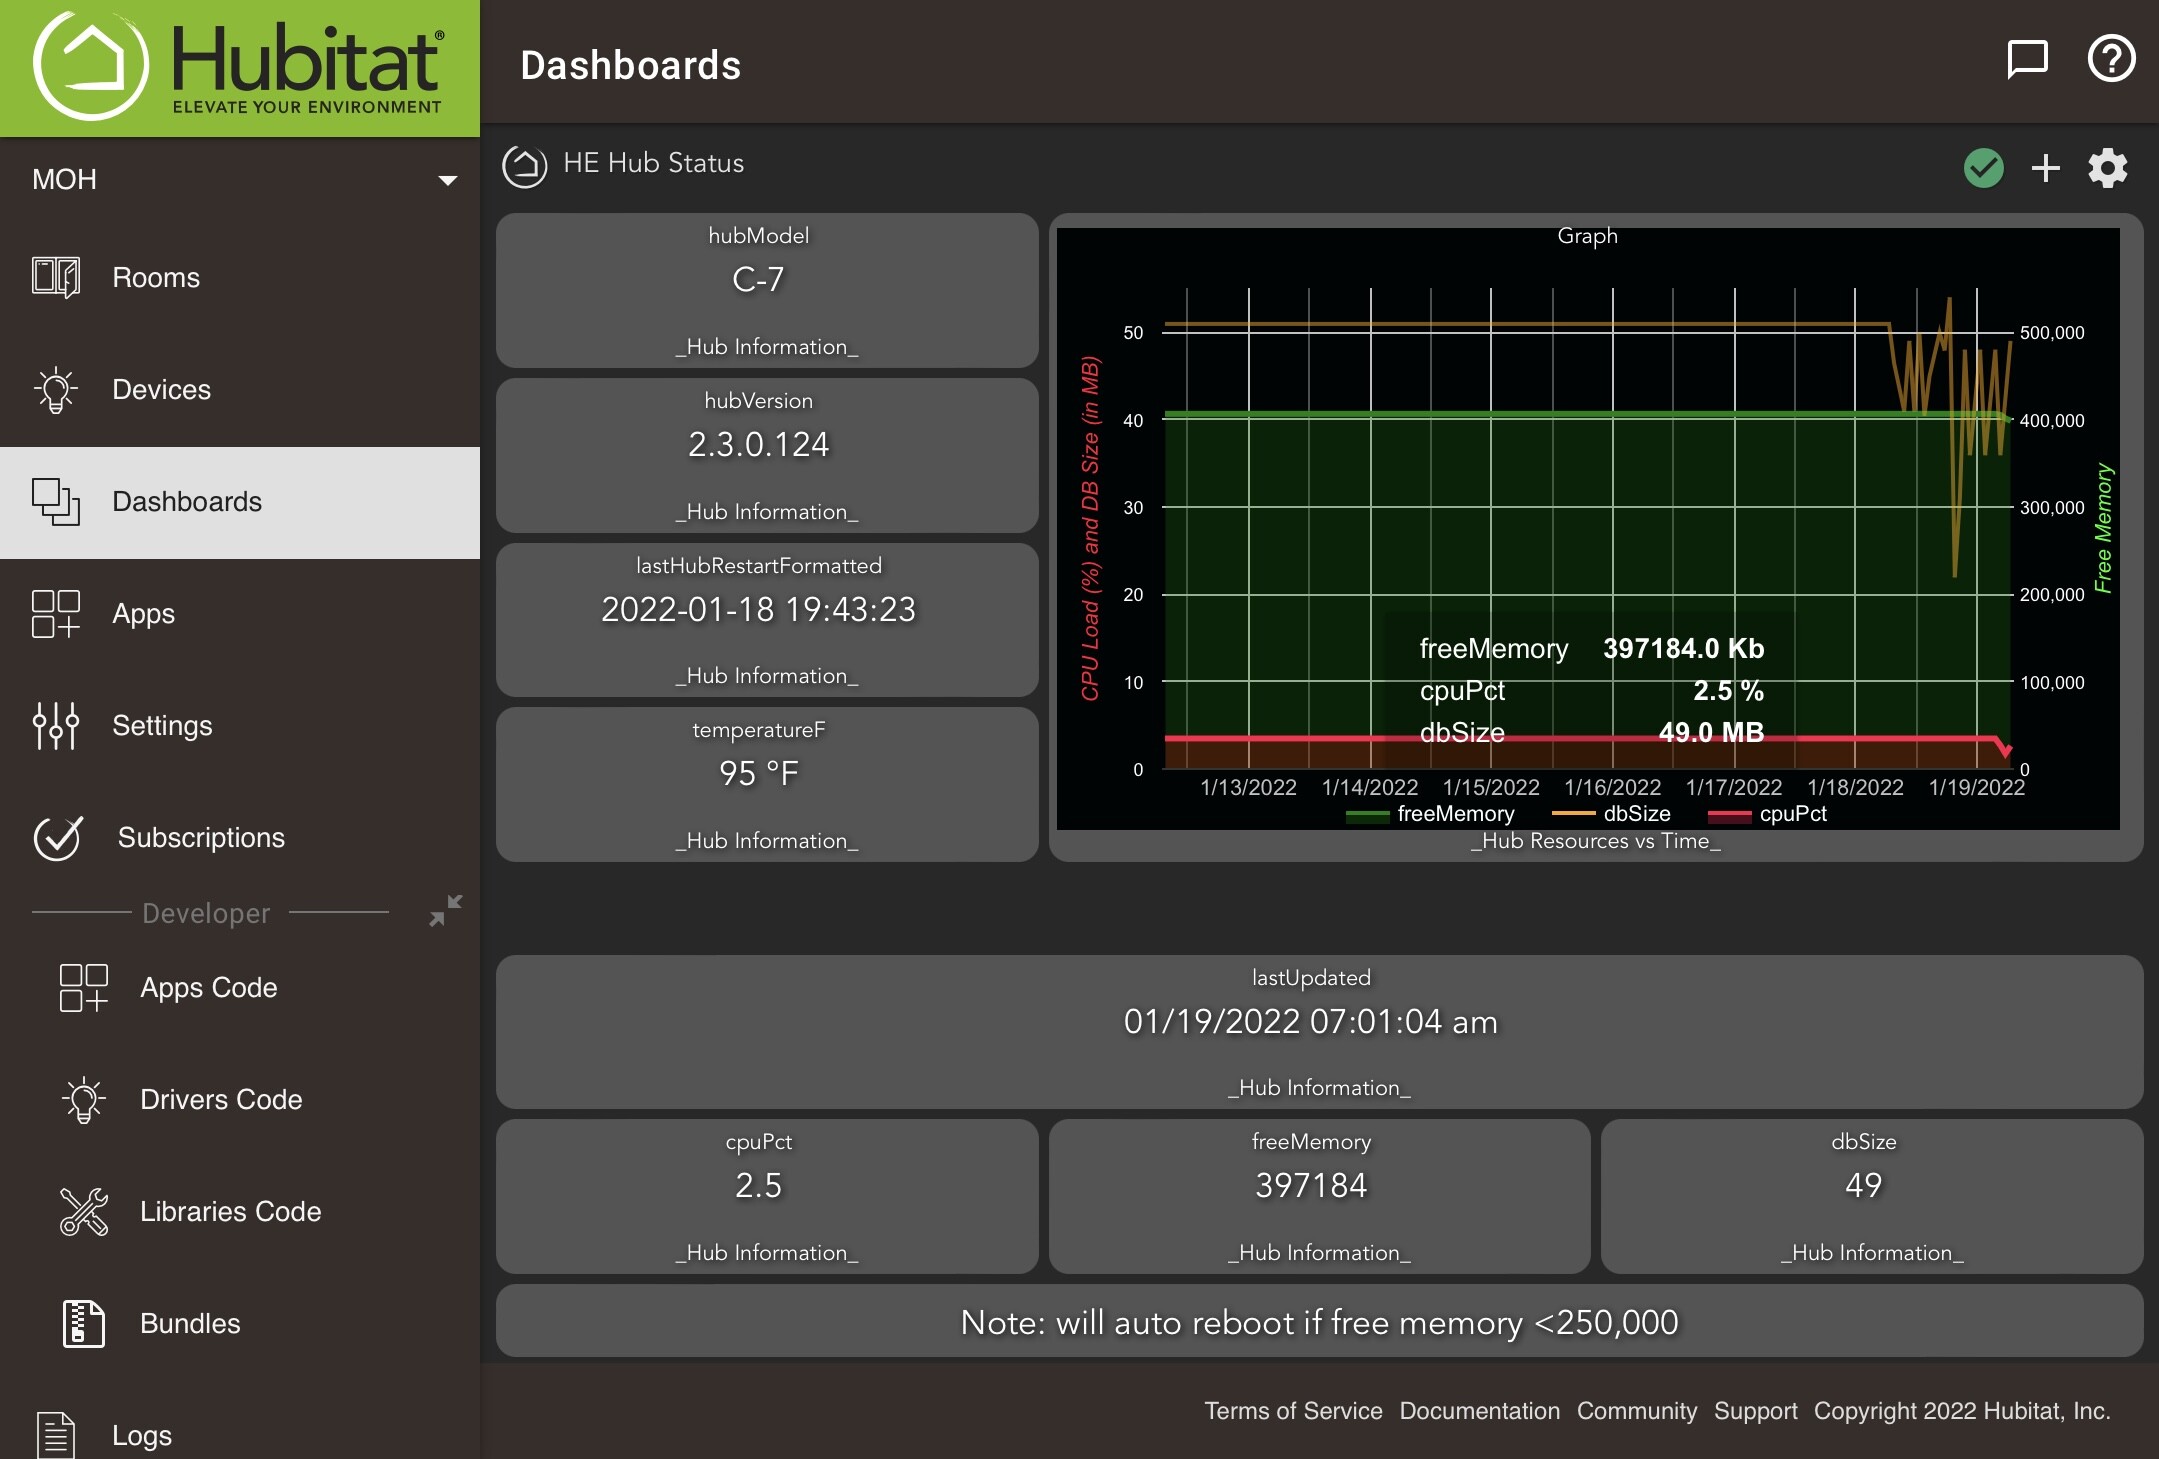
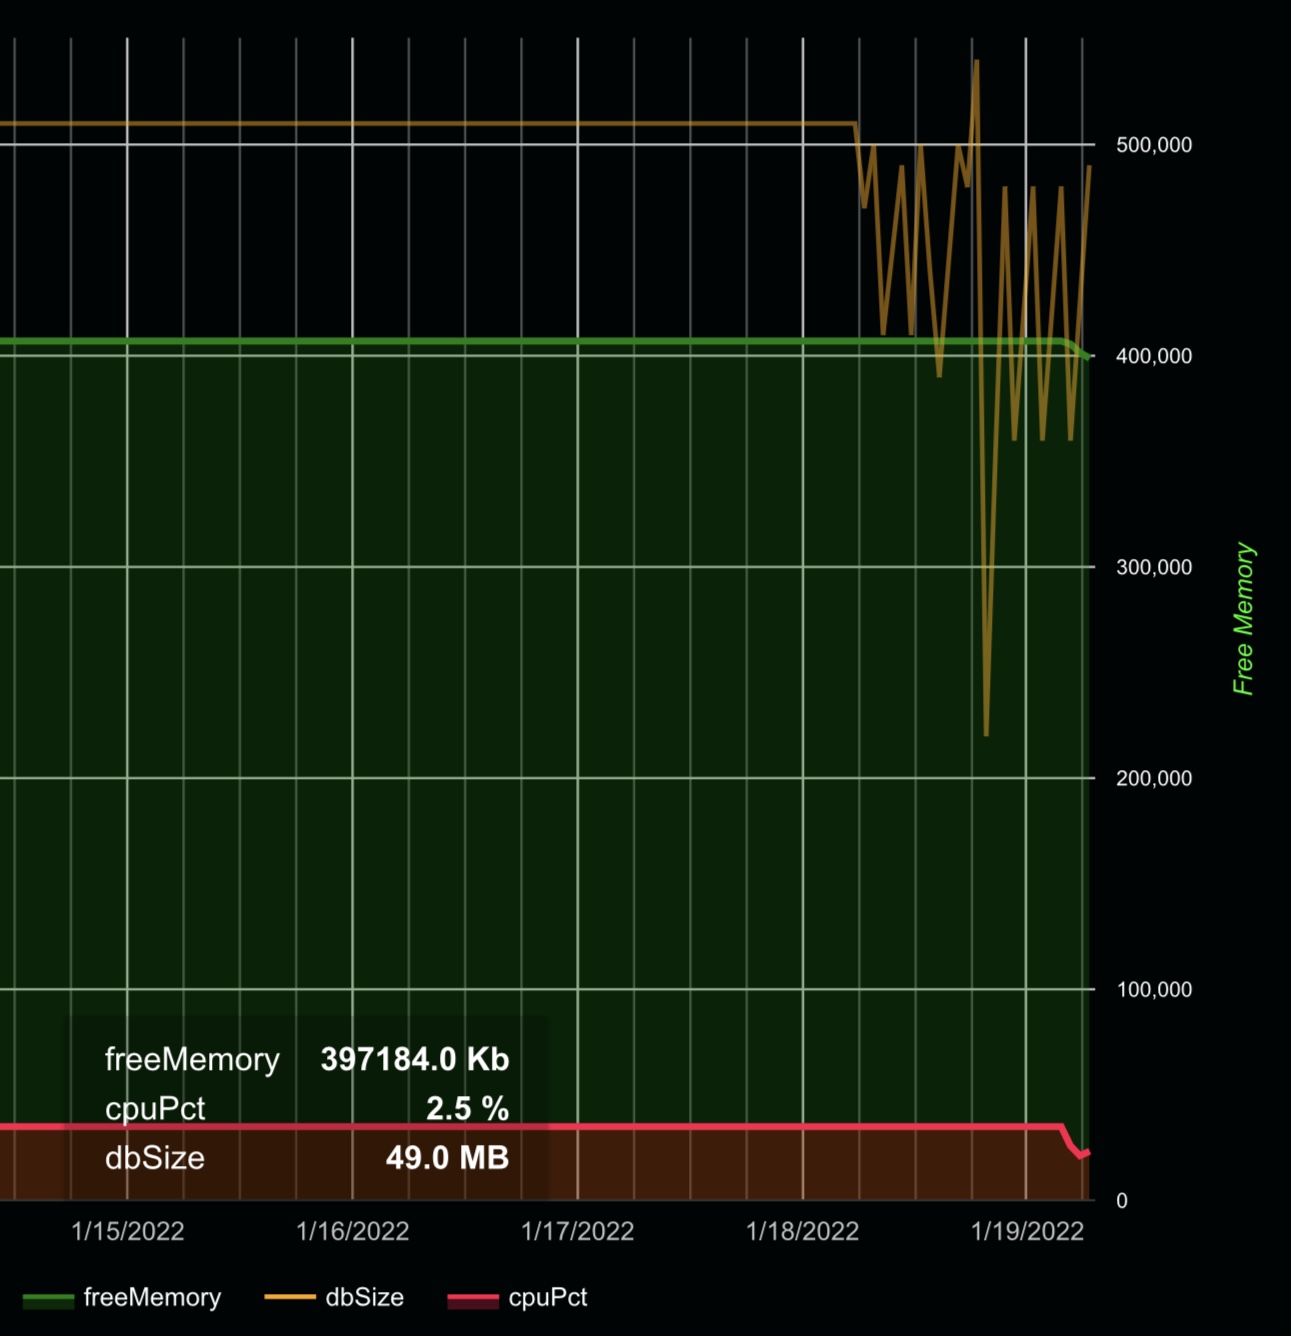
I am using Hub Information Driver to get the information into Hubigraph and have successfully created a dashboard graph on 1/17/2022 as can be seen below (I manually rebooted on 1/18/2022 which is reflected in the change in the DB line…there is no data prior to this indicated by the flat line to the left):
I have set my Hub Information Driver virtual device to poll every 300 secs (the default setting) and Hubigraph to update the graph every 10 minutes. As you can see, the DB line shows data from the time of the reboot, but the CPU% and Free memory only shows a the most recent few data points. This is true during the time I have tested this for the past few days. In other words, Hubigraph seems to “dump” older CPU% and Free Memory data (but not the DB data), OR, Hub Info Driver is not keeping the CPU/free memory data for more than a couple of hours.
As a relative newbie, I am assuming that I am missing something very simple in the Hub Information Driver virtual device settings or the Hubigraph settings but for the life of me I can’t figure out what I am missing. Any help is greatly appreciated!
This will most likely be the settings for how many events you are choosing to keep on the Hub Info device. Can you post a screenshot of that section of the device page, where the Device name / label and driver are displayed.
You may need to increase those settings to store longer periods of time. I remember there was an option for local storage in Hubigraph that may also help, but I can't remember the status of that feature.
It will only display the number of events it can see in the devices event log. If the events is set low then that is the reason.
What you can do is save those device attributes in Long Term Storage within hubigraphs.
Then when you define the graph you can enable LTS and it will display those events that are stored. Maybe up to a weeks worth if you choose.
Thank you @sburke781. Since I am at work, I will check the logs when I get home to check the settings. IIRC, thinking that this might be the problem, I set the events setting to 300 per attribute. With my polling rate, I though this would enough but will check to see if increasing it will help. Also, I do not recall what the States per attribute was set at. At any rate, it still seems strange to me that the DB seems to have precedence as the order in Hubigraph was set to Free Memory>CPU%>DB.
To @bobbles, thank you as well. In my search for answers, I seem to recall that the LTS feature had a history of problems at one time dealing with hub security (which I have turned on). Some thought it had to do with hub firmware versions, others thought otherwise. A few community members tried to see if they could do a work around to this. Alas, with the developer of Hubigraph no longer supporting it, he did not provide any input nor opinion. Do you know if LTS currently works (I am on the most recent Hub OS version)? I guess I just need to make sure that I can get my Hub Info virtual device to pick up more of the CPU% and Free Memory history before I even need to consider using LTS anyway (I’d prefer to keep my hub security activated).
Just to update: with everyone’s help, problem solved. I had failed to hit the Save Device button when I thought I had increased my State history size in my Hub Info virtual device so it “reverted” back to the previously set value of only 200. Given my polling interval of 300 secs (12 times/hr) I figured I needed 12x24x7 or 2016 data points per attribute for my State history size to cover 7 days of data. I had entered 200 rather than 2000 (the max setting), thus the lack of data points for CPU% and Free memory (again, I’m not sure why DB state was preferentially logged).
BTW, what is the most resource efficient way to graph 7 days of data? Is it to just max out the State and Event History size in the virtual device and set the graph timeline to 7 days (how it was apparently done before LTS), or to set lower history size in the Hub Info virtual device and use LTS to save the data with a LTS setting of 7 days? Or does it really make any difference since the same amount of data will be taking up “space” on the hub?