Hub Low on Memory Alert, Have Questions

@wiegout

Even when memory drops below 120M, your rule will not reboot the hub until the next occurrence of 2:30AM. Was that by design?

2 Likes

Do you get notified that and then it doesn't happen, or does it just not doing anything. Your rule appears to wait for 5 min and then execute at the next time 2:30am passes. You say above though that your cycle for the HubInfo Driver is set to 15 min First thing i would do is make sure that the "Stays that way" time is greater then your polling interval. Memory actually changes fairly frequently. I have mine poll every min because I wanted to see momentary spikes better. Every 15 min is really not going to show anything other then very large trends, which may be all you are after, but just pointing it out.
It is also possible that you are seeing it get low and then garbage collection recovers the memory to a good state and the condition is no longer met.

I would suggest you actually split this into two rules. Set a Global variable up that just has a number. At the proposed reboot time have it look at that number and if it is over a said value reboot. Then have a rule that monitors the hub memory and if it goes below a set value have it update the Global Variable+1. Lastly as others have suggested use the Hubinfo driver to reboot instead of trying to post to the URL.

I have tried a lot of different things. No, the trigger never fires to give me the first notification to my phone so I know the trigger isn't firing at all. If I add a certain time, it fires. I will try setting it back to 1 minute. That's what it was, but I wondered if that was contributing to the memory leak. And yes, @aaiyar I wanted to wait until the middle of the night before rebooting in hopes of not hurting the WAF. I'm thinking the "stays that way" is causing the problems.

It very well could be. I wasn't saying though to set it to ever min, just that i am doing that. I was just trying to point out that your polling interval and then the wait interval didn't really match up to make sense. If your polling is every 15 min but only waiting 5 then you might as well just not use the wait time at all.

I just checked for my rule similar to this and i literally just check at 2:30 and if freeMem is to low. If it is below a threshold I submit the restart via the HubInfo Driver.

If you never want to restart it until that time anyways then that will doing in the simplest way possible. No need to check it on every change, or throughout the Day.

Well, it's a good point. My thinking was that I might indeed want to reboot it if I know that it won't cause a problem. Hence the "you should reboot it, or it will reboot automatically tonight." But, I have changed it to match the consensus opinion about the approach to use. Note that I rebooted a couple hours ago and have already gone from 577mb to under 200mb free memory. Granted, a good GC might come along and clean that up... We'll see if this ever fires. Thanks guys.

I would really be curious to see all of your apps and rules.. There has to be something causing the memory to drop that fast. My prod hub which has a bunch of crud on it and some not the most memory friendly and at just about a week it is still over 200mb.

There has to be something causing all kinds of activity to drop it that fast.

You mentioned above that you didn't have this problem until you added a Kaza LED Strip. Does it have any rules workin going it. What are they?

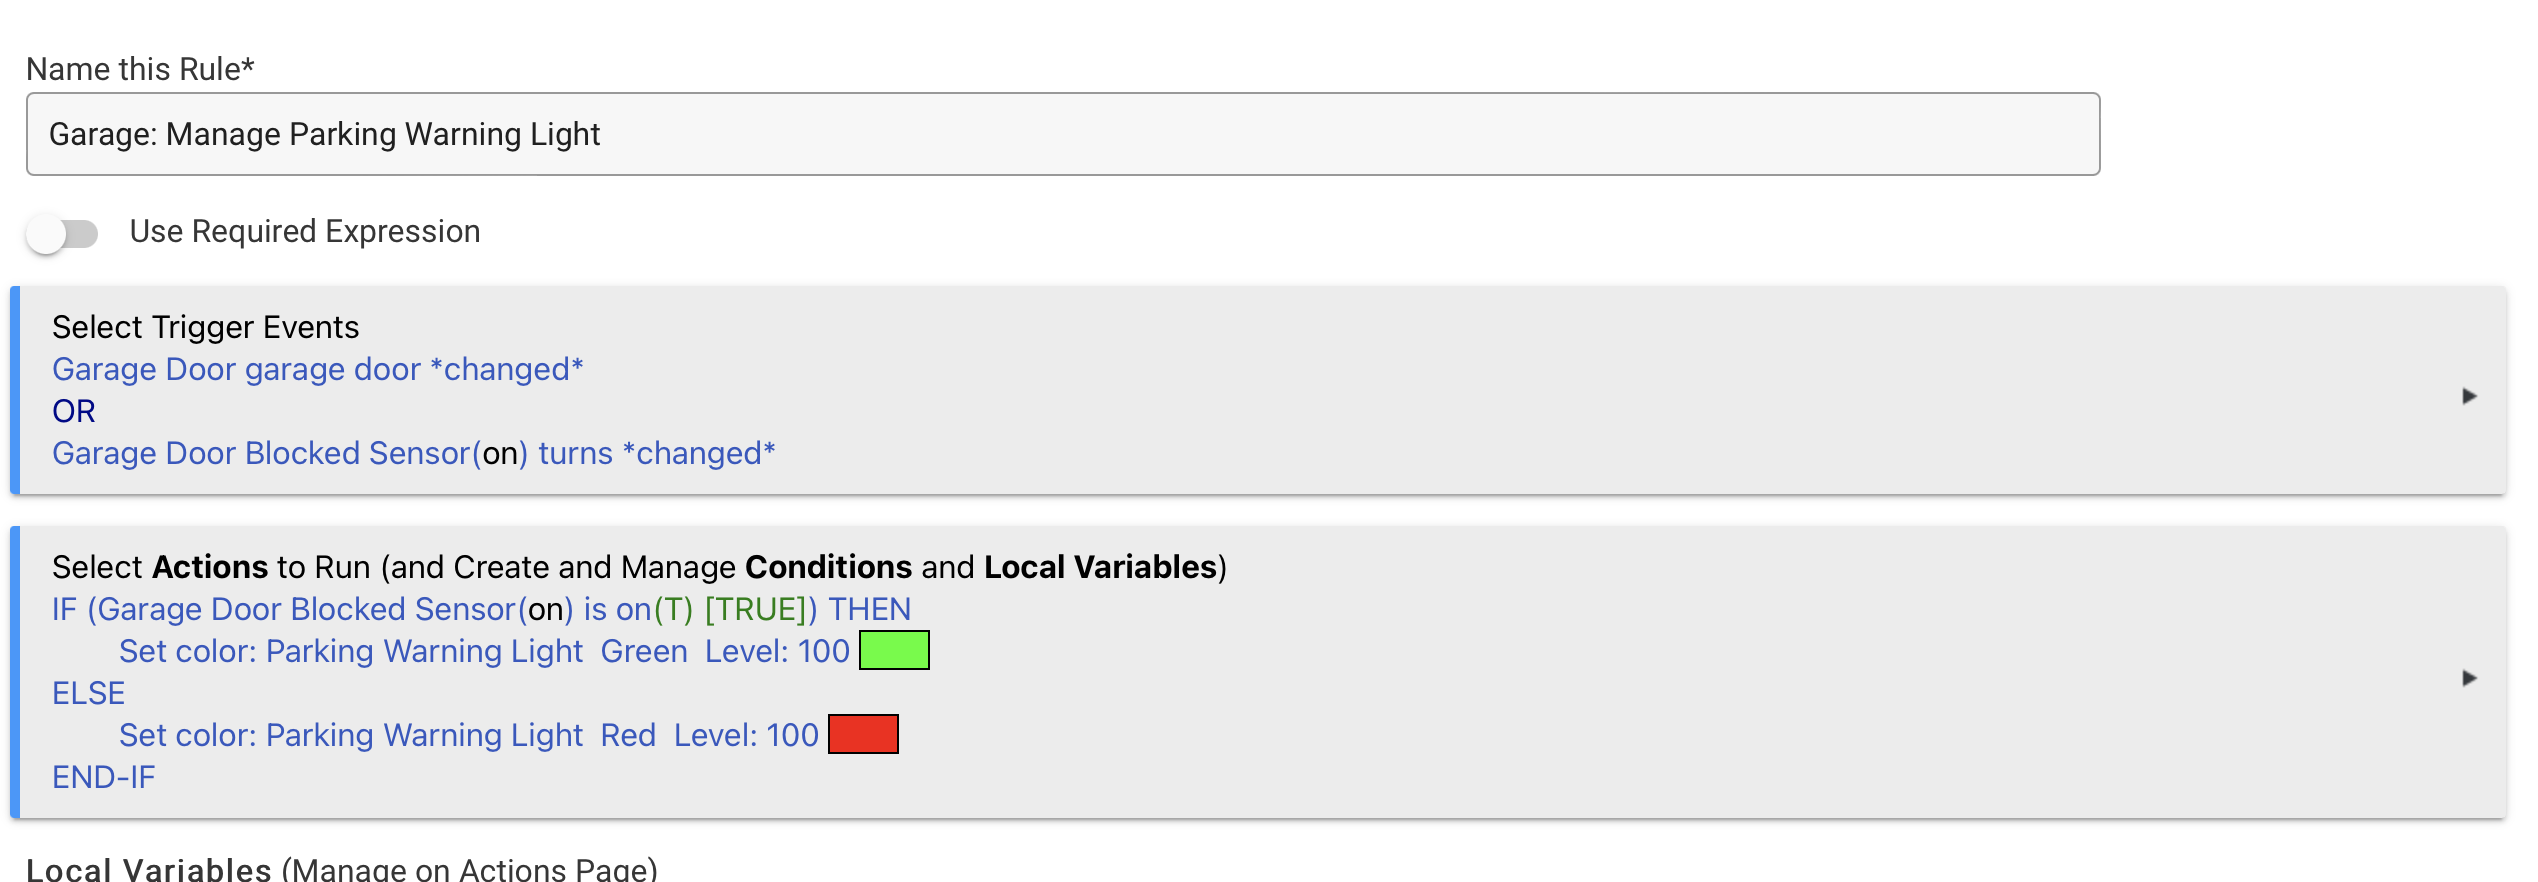
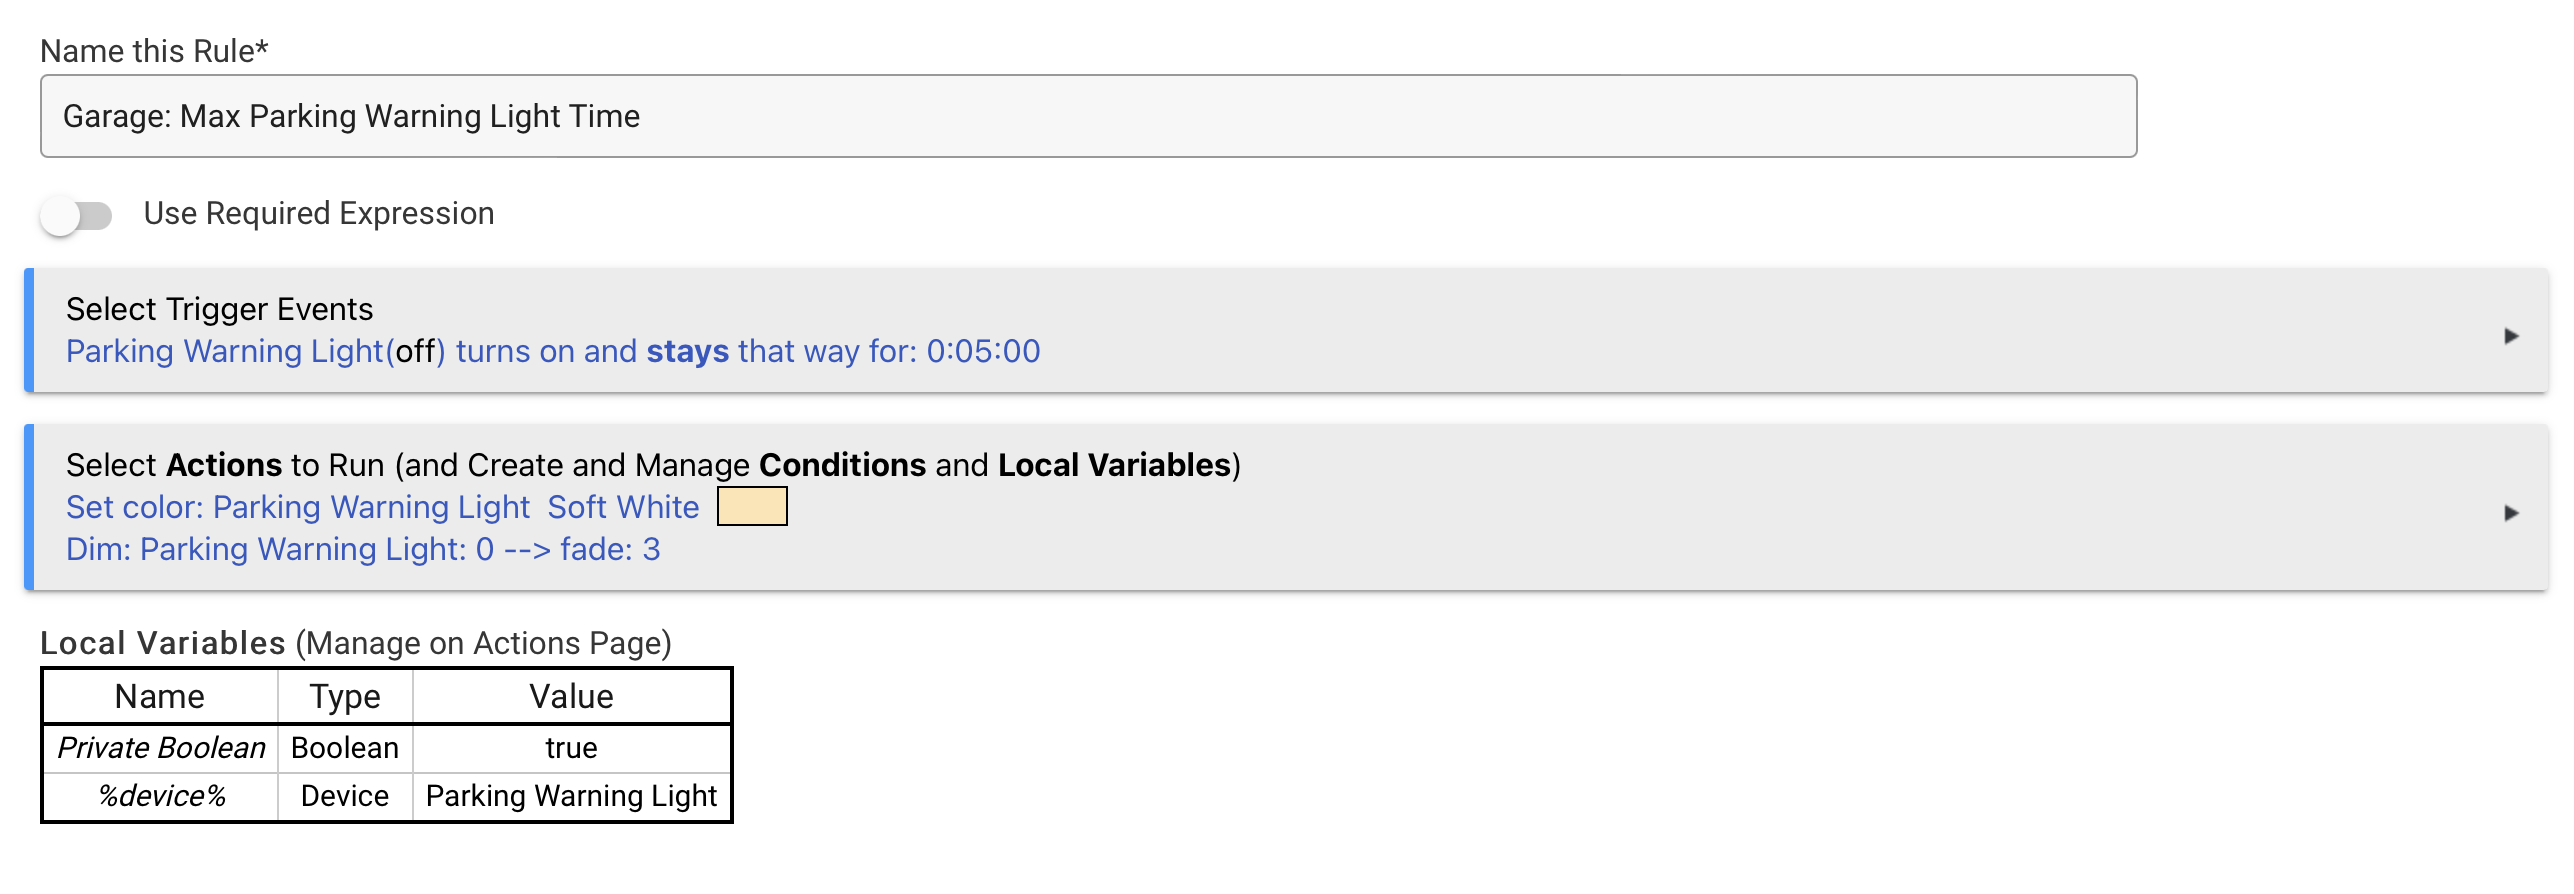
Well I have about 100 rules. The two new ones that I wrote in connection with the new Kasa RGB strip light are below. This strip light is a parking guidance light that is red when a beam at the garage entrance is blocked and green when clear.

and

This is a (very successful!) riff on the project in this thread: Garage Door Blockage Indicator System

I am curious. If you got to the Logging page, how fast is it scrolling? Does it scroll by pretty quick, or do you have most stuff turned off?

Do any of those sensor that are part of the triggers create allot of incoming events?

1 Like

Don't see anything that looks out of the ordinary. What would be helpful is to know what can consume memory in the JVM. Is it device state? Errors? Something clearly grows over time eventually (3 days or so) consuming all free memory that is not available to the JVM garbage collector. Don't know what to even look for. Rebooting frequently is my only recourse for now. Anyone know of a handy resource about resources? :slight_smile:

I know it probably be painful but i think i would start with removing Echo Speaks, Homebridge, and Roku Connect. Just because they have been there a long time doesn't mean something didn't happen with them that could cause the load to increase as well

I know I have seen things before about both Homebridge and Echo Speaks causing heavy load.

Do you use Maker API for anything. I have seen that bring my hubs down as well. I had a virtual device that as potentially getting several values at once and it brought the hub to it's knees.

I might also suggest you start looking through your rules.. At around 100 you certainly have allot. I have 36 so only about 1/3 of the way to what you have. Look for anything that runs on repeating intervals instead of being triggered by events. Those have potential to create bad things especially as the repeat interval gets smaller.

Lastly do you have anything like Webcore with the Hubigraphs add on, or influxDB with Grafana to visualize your hubs overall stats. Being able to see something like what i have below may help shed some light on what is happening..

There is also the possibility that you also have simply outgrown the single hub and may need to think about splitting the work over more then one. Maybe a inventory of the total size of your environment would help put perspective as well. Like how many and wha apps/rules you have loaded. How many TCP/IP Lan devices, Zwave devices, Zigbee devices, and virtual devices.

1 Like

Well to be honest, Hubitat without Echo Speaks (in our house) is a non-starter. It's that critical. HomeBridge brings the whole smart home environment into the Apple world. We're very apple centric and the ability to control things via Siri is critical too. We could live without the Roku integration though. The thing is without being able to "see" the effect of changes, you're just shooting in the dark. Two hubs could be a solution - I have a C8 that I've yet to deploy. BUT without knowing where the resources are being squandered I may not devide the work efficiently. Really a crappy situation to be in at this point. After 3 years of Hubitat being super reliable, now it is not so much.

Yeah but is that due to hubitat or one of your 3rd party apps. You can't blame hubitat for other people's software only their own. Diagnostics is a process of elimination. @mavrrick58 is right on all of his points. You need to start turning things off to check the effect on the hub. If it turns out echo speaks is the culprit then grab a cheap google speaker until TTS comes out for homekit. IF it's home bridge, use the built in Homekit integration. There are ways to overcome some of the limitations like locks and lan devices. Moving those things to another hub may not solve the issue.

I have Echo Speaks with 7 Echo (Gen 1) devices plus 1 Echo Flex device, and I don’t see the memory loss. Cookie server is on Raspberry Pi 4b, not Heroku. I don’t have the other integrations mentioned, but I do have several other cloud integrations ported by Dominick Meglio (MyQ Lite, SureFlap Pet door, Litter Robot). Again, I’m not seeing the memory loss, only reboot when there are Hubitat firmware updates.

1 Like

Well like I said i figured it would be painful. I get it and it sounds like you are in a tough spot with home usage. That said i think the fact you have a C8 gives you a good opportunity to split the Lan and non lan stuff up.

That is true, but It is all about what we ask it to do. I kind of think you may have just pushed the hub over the edge with something.

This is why I am trying to go through a process of elimination to help you isolate it.

Being that you have a C8 this would probably be what I would do after validating you don't have any known troublesome devices for the C8.

  1. Go through the migration and ensure that everything is working with it. Leave the C7 off. after the backup is complete for the migration.
  2. Once you are confident that the migration completed good to the C8 you turn it off briefly so you can clear the radios on the the C7. Only after you are comfortable that the Zwave/Zigbee stuff is working. Then turn the C8 back on. Make sure it is all working
  3. If you have static ip's for the hubs put the C8 on a new IP and the C7 back on what you were using.
  4. Now go through the process of using Hub Mesh to get the devices in sync between the C7 and C8. Remove the Lan integrations from the C8.
  5. Cleanup the C7 so it doesn't have anything but your lan related integrations.

The goal would be to isolate your zwave/Zigbee stuff to the C8 so you can use the new radios and then all the lan stuff on the C7.

If you still have issues on the C7 it is something to do with those rules and apps, If it follows to the C8 then it is something else and need to look at whatever rules were left.

I am trying to go through the process of elimination. I know i have seen threads were Echo Speaks has been blamed for performance issues. I am also certain there are installs that are fine.

Potentially Echo Speaks is an issue, though I've used it for 3 years. I have so wanted to dump Echos and move to HomePods. I have bought two to test and am ready to jump ship. But, the lack of TTS for HomeKit holds me back. Sigh. Yes, I think for now I'll just reboot the C7 about every two days and then migrate to a C8 and eventually move all the LAN stuff over to the (then freed) C7. It's one way to double the memory... Thanks for your help. I'm really thinking the last Kasa device is what really did me in.

1 Like

Yeah, that was me until just a while ago. Rarely rebooted. Would love to get back there.

2 Likes

I wonder if you have some processes that are taking just a little bit longer and starting to overlap. over time that can add up and compound to slow things down.

Do you have any visualization like i showed above to see trends with cpu and memory resources? It can be done with the Webcore graphing option, or with the influxdb Logger and Influxdb on a local always on computer or a free influxDB cloud account.

1 Like

I don't have any visualizations like that, but wondered about the same thing. Since the new Kasa strip is largely driven by a IR beam attached to a Zooz17 I wondered if this RM app was problematic so I paused it.
I mean, when we walk around in the garage we could set off many of these on/off/time apps.

I don't see anything in that rule that really should cause that much load. It will be interesting to see how the hub performs with those off. What are the cool down times for those devices. ie how long between showing activity and then no activity.

Setting up InfluxDB Logger with the Hub info driver to write to INfluxdb Cloud is pretty simple and i have a dashboard already created for this in my test environment if you decide to do it. Just hit me up on a pm.

1 Like

This topic was automatically closed 30 days after the last reply. New replies are no longer allowed.