Very recently I've been getting the Hub Load Severe warning on a daily basis. Rebooting solves the problem temporarily but it comes back within 24 hours.
I tried looking through logs and fixing anything that looks remotely suspicious but it isn't really improving either.
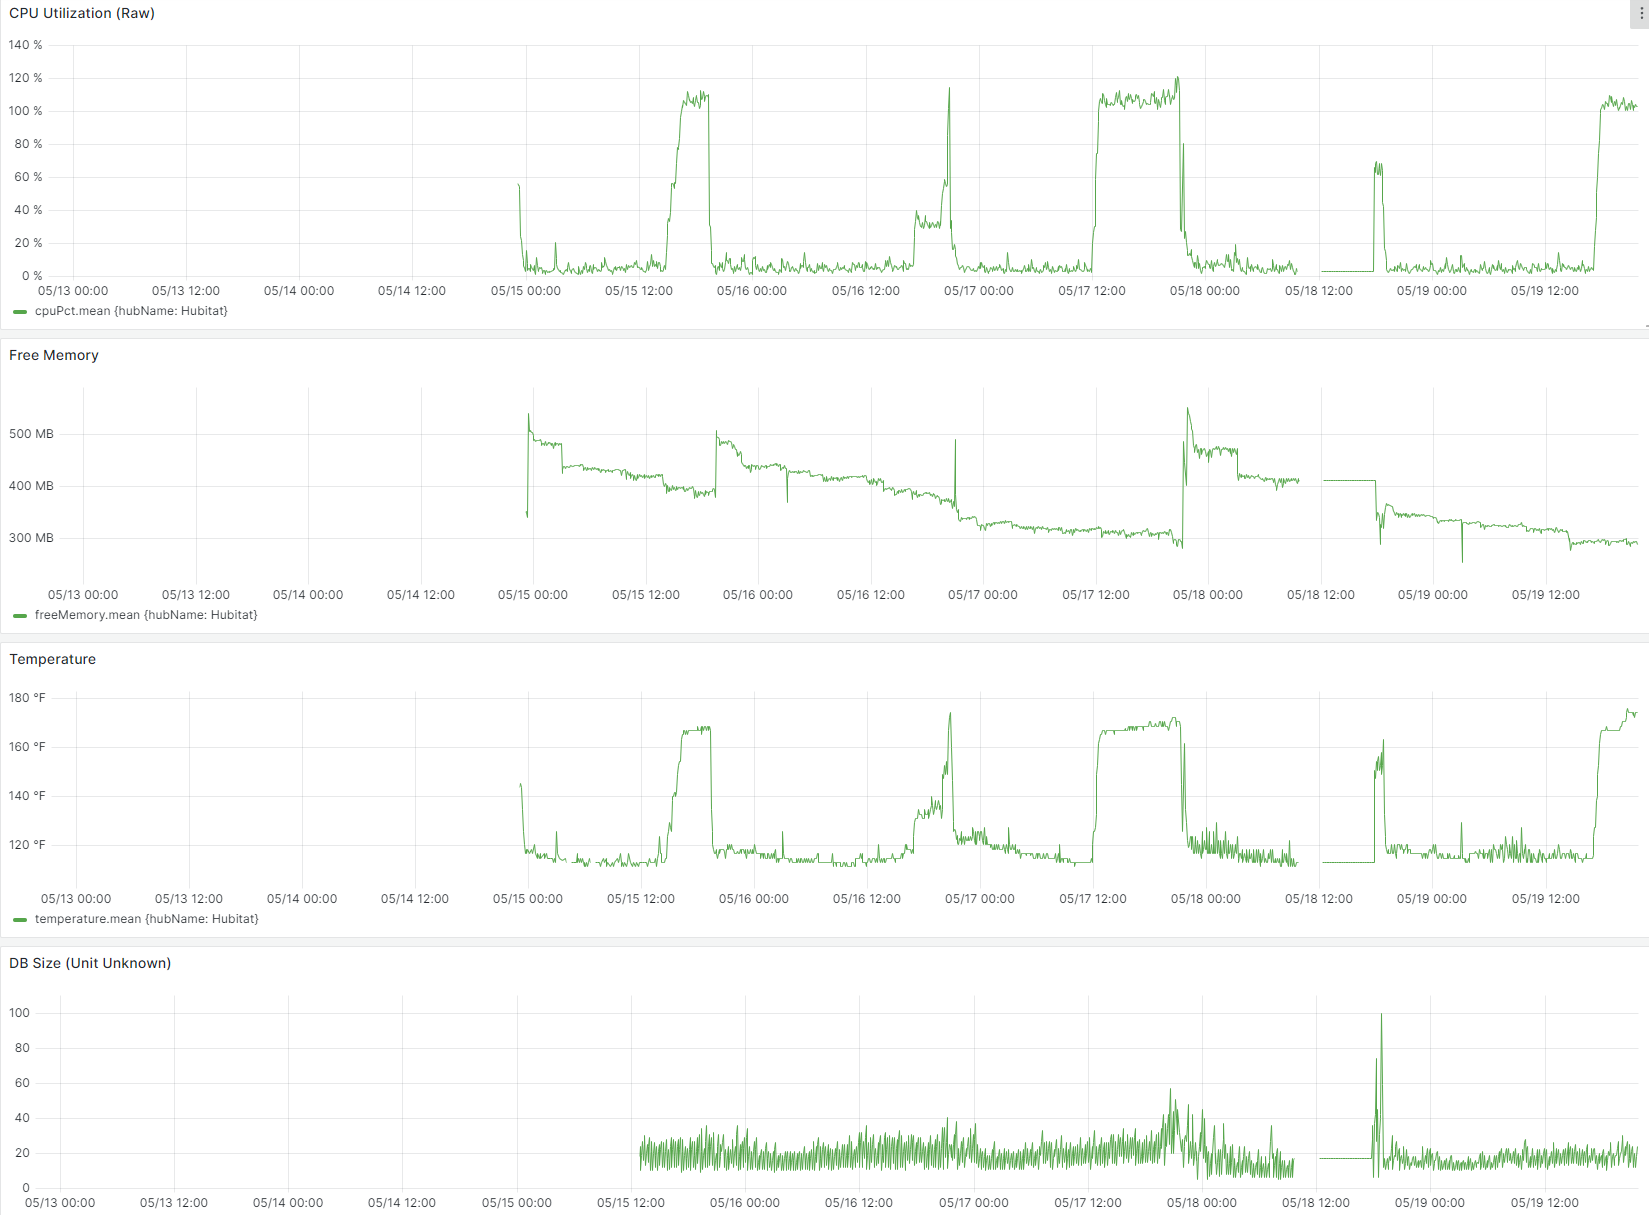
Here are my CPU loads the past few days... it just jumps to 100% at random times.
Looks like you have a lot of LAN apps/drivers. In my opinion it is almost guaranteed to be one of those (ecobee, switchbot, LQ ThinQ, Rachio, etc).
Since it is happening so frequently I would just try disabling your LAN integration apps/devices one at a time until you figure out which one it is. To disable them go to the app page, click the little grey "X" on the top right, then it will show the disable checkbox next to the apps.
In addition to @JasonJoel 's good suggestions, I'd also recommend considering what you have added recently, whether it be Apps you have installed, modified or new devices you have created. If any of these events line up with your elevated load symptoms, that may provide some insight into the cause.
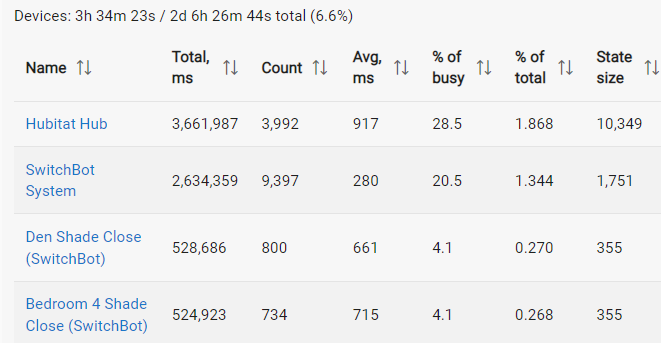
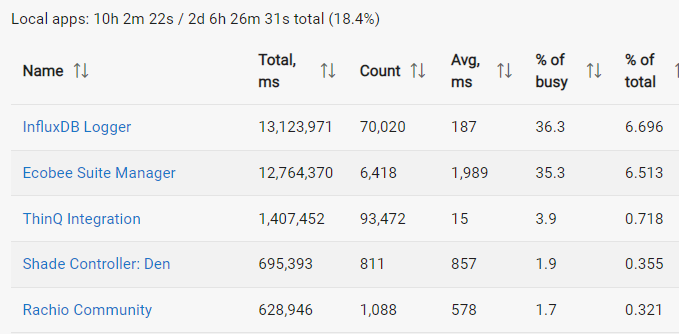
That said, SwitchBot and Ecobee do still seem like they are the likely candidates for causing your issues...
Actually, in addition to what has changed recently, I would also add into the mix, what time does your nightly backup occur, I would guess midnight, but I don't believe that is the default...
Thanks for the ideas. I was thinking it might be one of these but they actually have all been running for quite some while.
One thing I noticed that made me believe it's not one of these apps is the fact that the total busy time only adds up to about 20%. This makes me wonder where did the other 80% go?
I also closely inspected the logs of these apps already and they very normal and responsive.
I wonder if it could be a hubitat platform or JVM issue? If the load is constantly at 100% it's likely not really doing something useful.
I'll try your suggestion and disabling them one by one. Yet I wonder if there's a way to do the equivalent of top on hubitat? That'll directly point towards the culprit or rogue processes.
I don't understand the internal software architecture of hubitat enough but I wonder if it's possible to write a Groovy app to do some Reflection to see what's actually scheduled or running?
Unfortunately I just rebooted. The top ones are only a few percentage and as far as I recall they were not very high. I'll circle back if I have more screenshots.
Sorry, it was sheer luck. The lux sensor wasnt reading properly and one if my rules was becoming sporadic in its operation. This began at the same time as my sever load warnings. It took me a week before I correlated the two being linked.
In my experience this is not an exact science, including my recommendations below... So it may take some perseverance to understand what is happening. I would suggest, as a starting point:
Think about devices / services that are like "chatty" in that they either communicate back to the HE hub often, produce a lot of changes to attributes or involve potentially long calls out to the Internet on a regular basis. If you are not technically familiar with what may categrorise devices in this way, that's fine, this part is only a "nice to have"
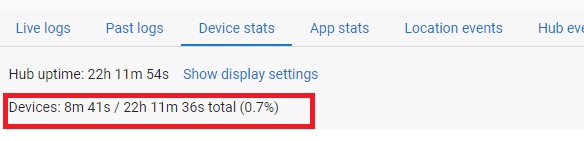
Look at the Device Stats and App Stats sections of the Logs page. Look for devices or apps that consume larger periods of the CPU time or on a frequent basis, or consume more on average. Try to not to get too scientific at this point.
With a short-list, look at the activities the devices / apps include, i.e. apps devices may be in use by, periodic updates in apps, rules or within device preferences, logging options available with the device or apps involved. From here, look at turning on logging as you see fit...
(Optional but recommended) Not sure if I or others may have mentioned it, but install the Hub Information driver.... If you have some data capture and reporting option like InfluxDB with Grafana even better
I can't claim the logging will provide insight to the average user that could be immediately useful to the average user in diagnosing the root cause for degraded performance. It will either trigger something to look at in more detail or may help in conversation with the developers, either Community-based or HE staff.
The steps following this will depend on what you find throughout the investigation and conversations that come from the exercise.
I have experience with a faulty z-wave driver or device bringing the z-wave mesh down...I didn't realize it happened with zigbee as well (Aqara motion sensor mentioned above).
I would expect Z-Mesh fails would present as more specific / noticeable impacts than spikes in CPU usage on charts.... I would expect to see automations involving those devices failing on a consistent basis,
170°F is a little warm. Definitely have an issue somewhere. 6-7% of total shouldn't be an issue, but just for giggles what happens if you pause/disable the Ecobee Suite Manager for 15-30 minutes?