What exactly does this mean?
I spent the last few day adding all my devices and now I’m concerned it was for nothing.
Where do I find the stats about the hub to post here.
This is so frustrating.
What exactly does this mean?
I spent the last few day adding all my devices and now I’m concerned it was for nothing.
Where do I find the stats about the hub to post here.
This is so frustrating.
Hub load issues can be tricky to track down.
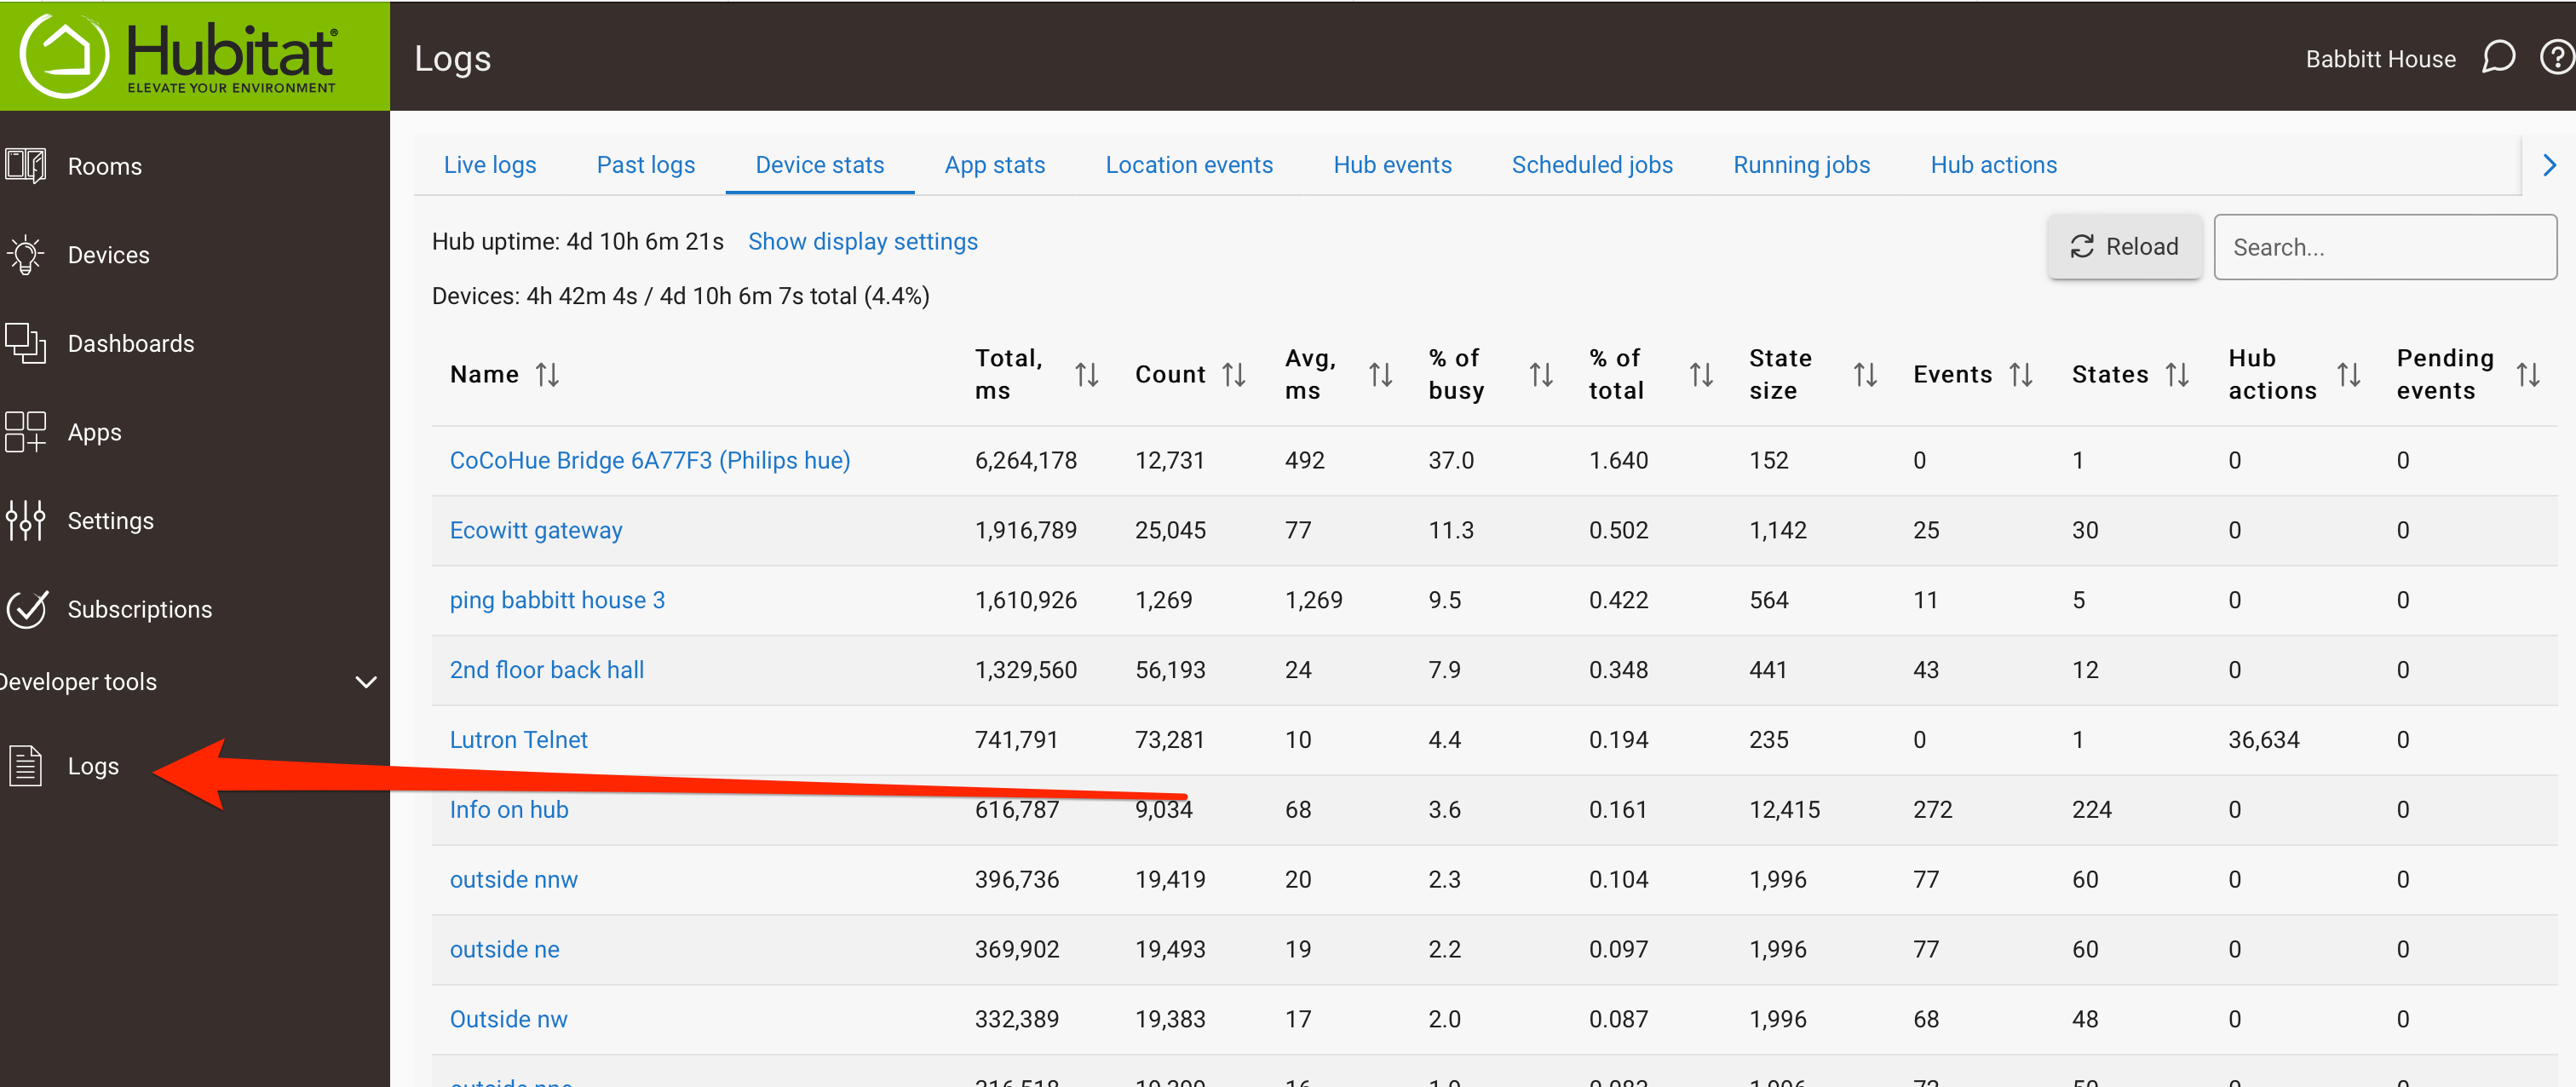
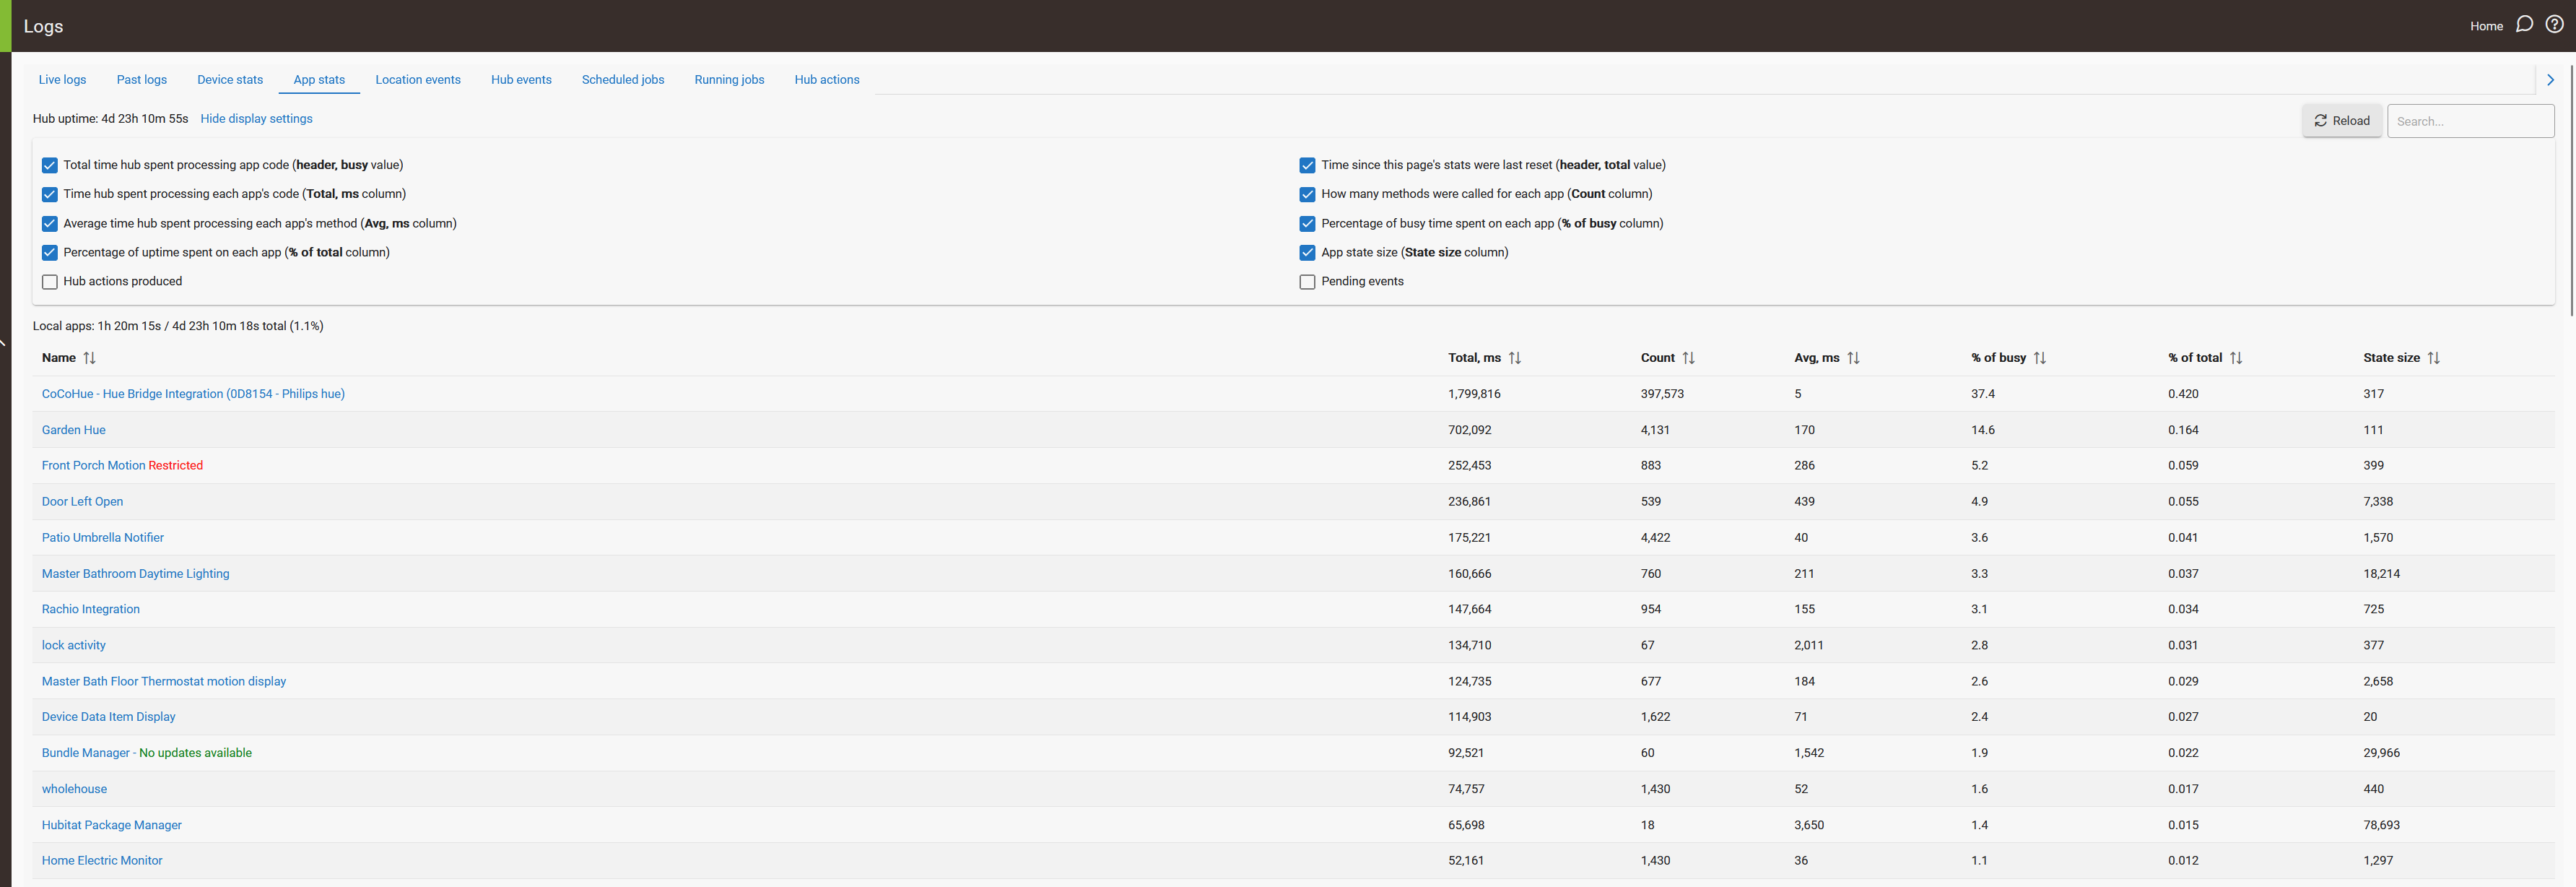
This generally means something is consuming a lot of hub resources. There can be any number of reasons for it but it's often an app or device (or multiple of each) driving a lot of events or a lot of IO. If you go to the Log page and then look at device stats and app stats that can help you narrow it down. I'd look at the % of busy column and sort in descending order for a start. If you want to post a screen shot here folks can take a look.
Sorry, how do I get to the logs page?
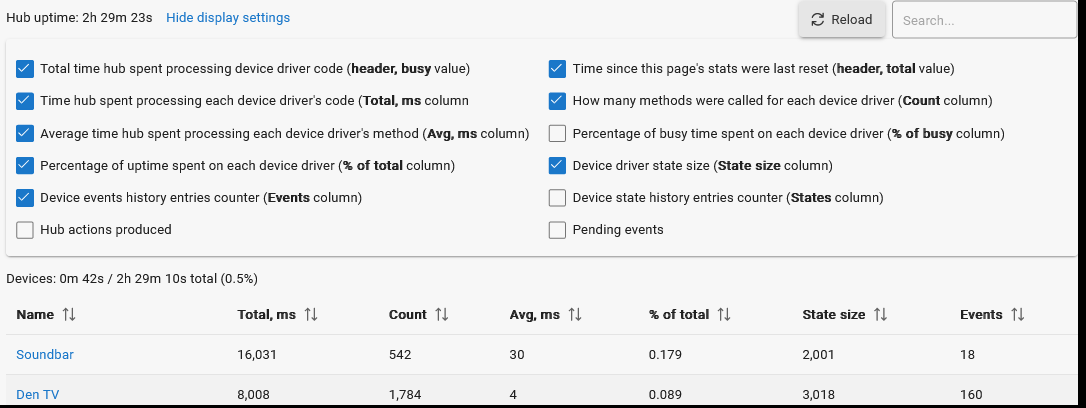
To get the Hub device and app stats, you open a logging window. That will then have tabs for Device stats and App stats. See below for Device stat example.
Critical are the values:
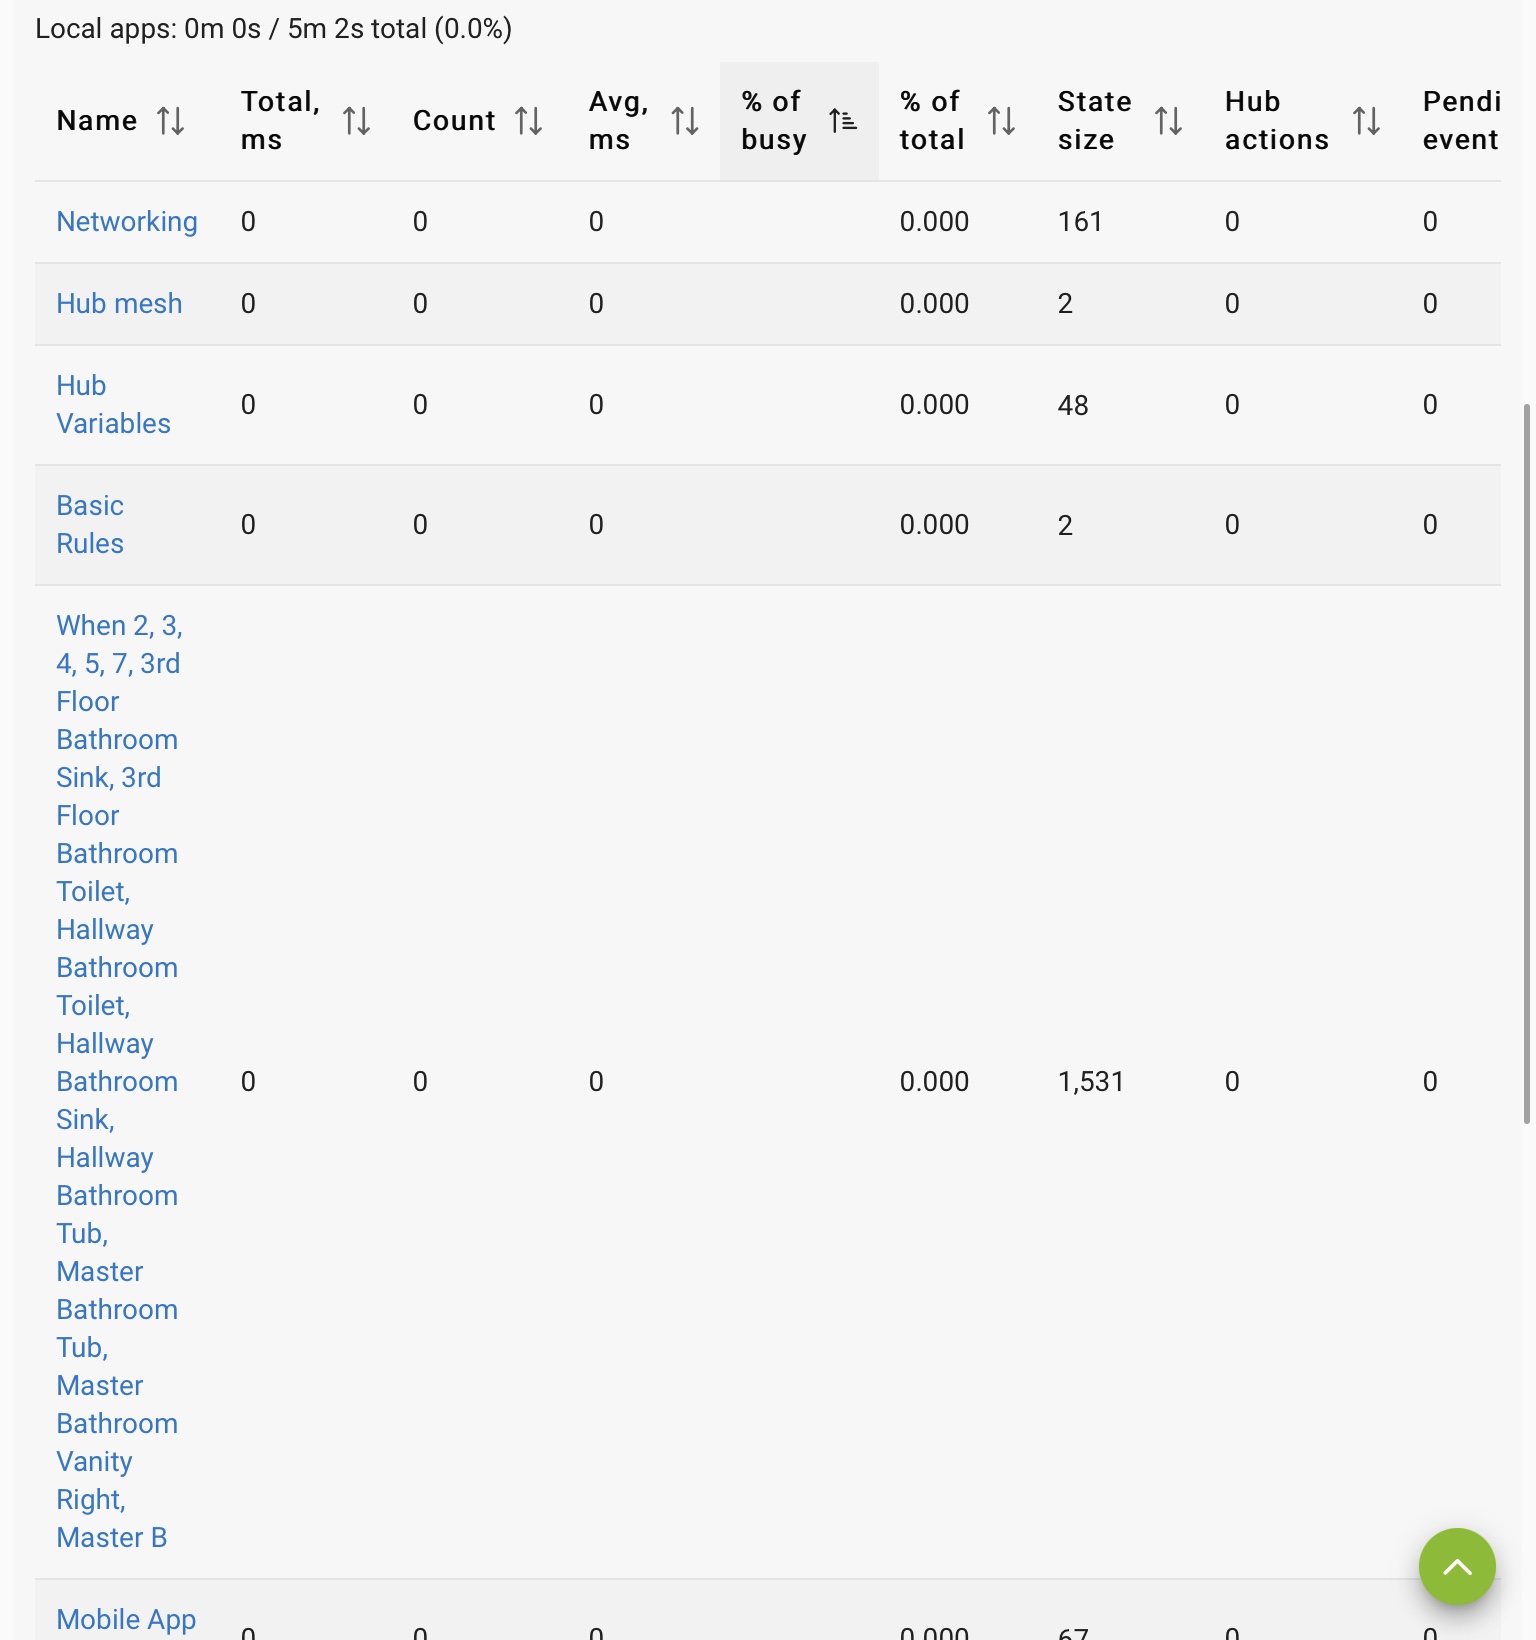
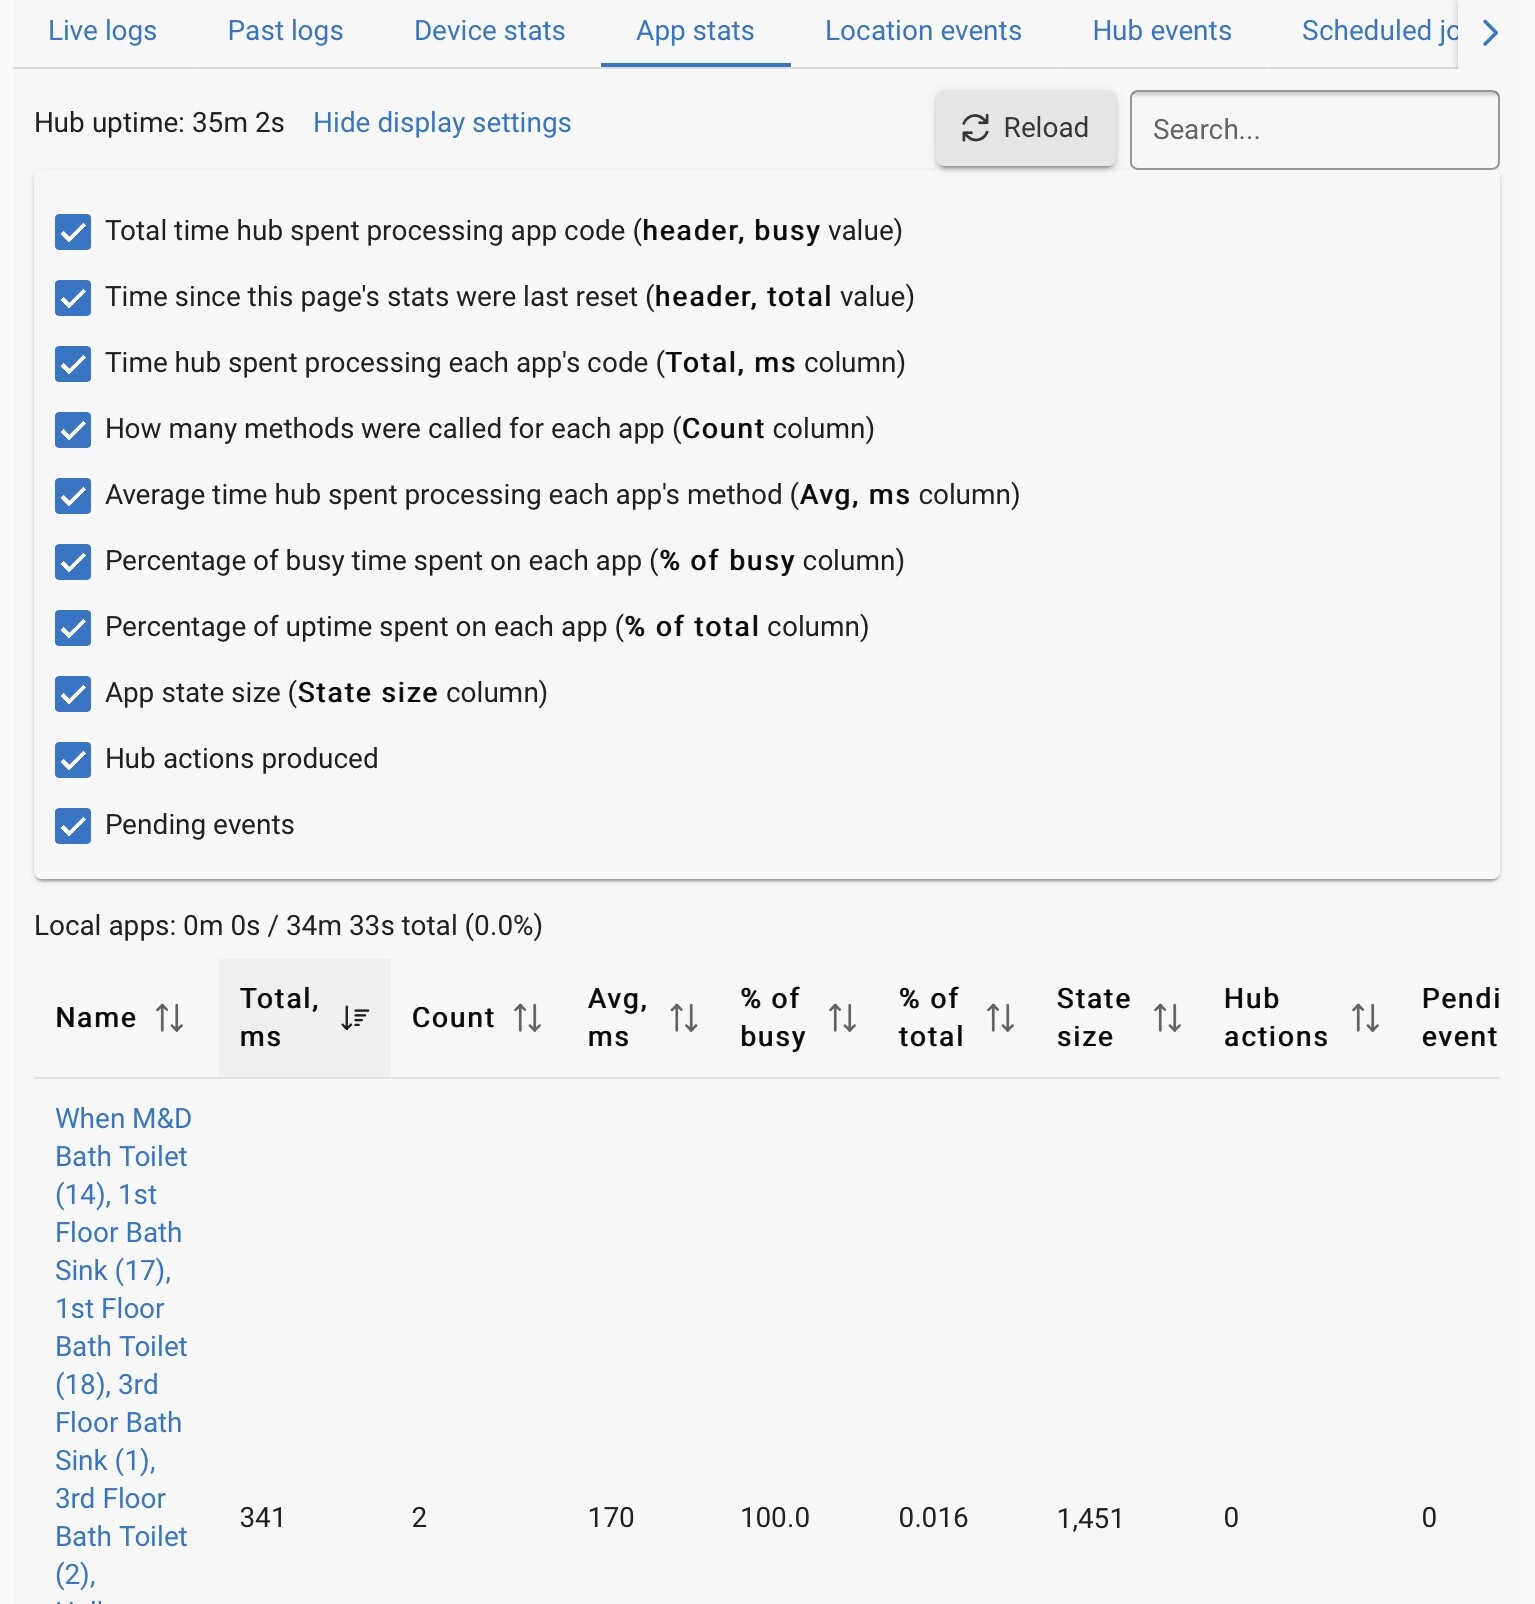
Then there is the App stat page (see below). Same information is important.
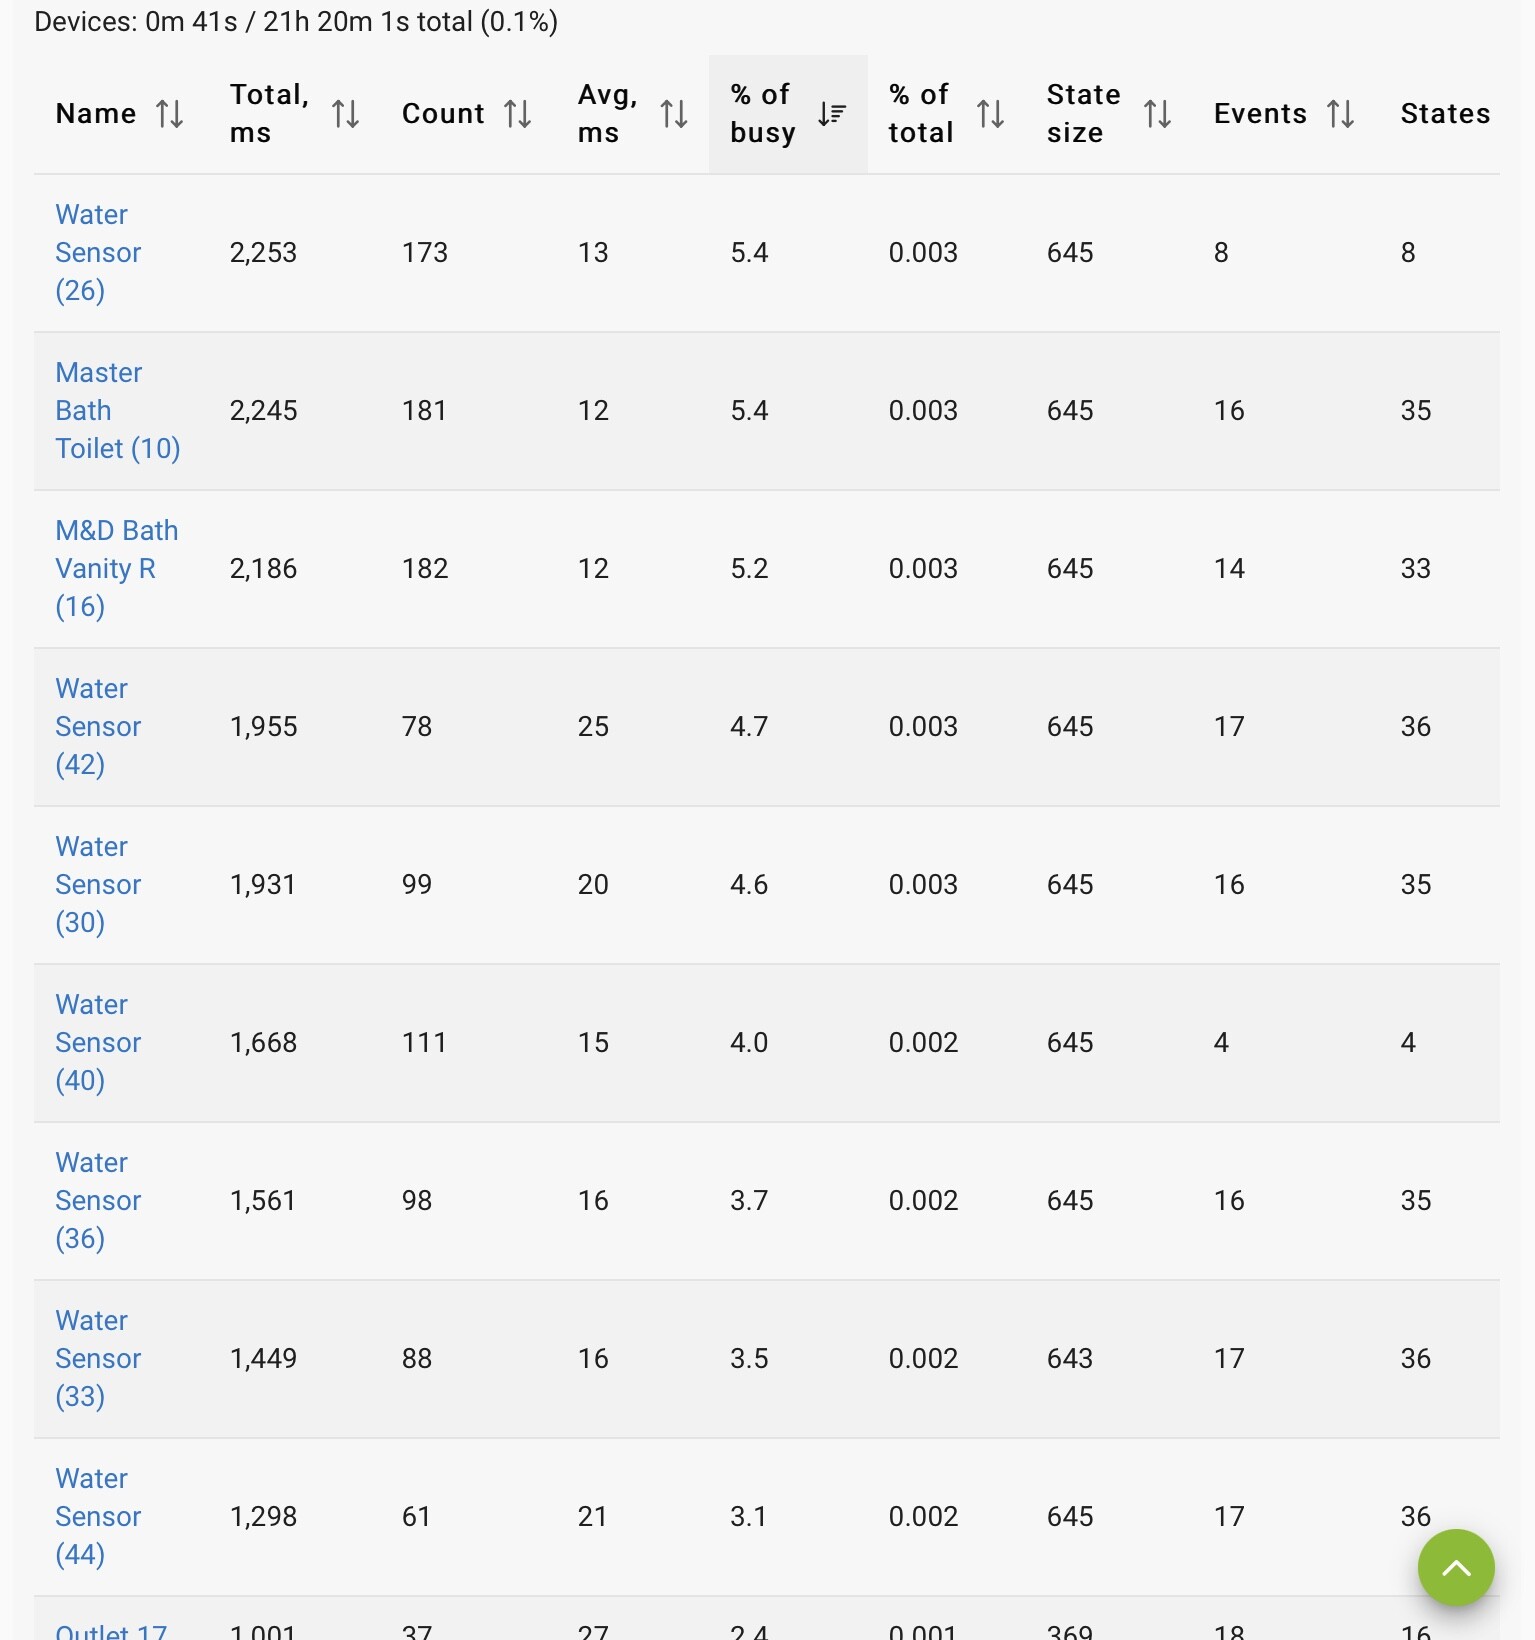
One other note. If you post, first sort the page of % of Busy so that the highest values are on top. That will make identifying potential issues easier.
Dave
How do you get to the logging window?
Go to http://yourhubip then on the bottom left click LOGS
Open the Hubitat page and go to devices. Select the three bars in the upper left corner. This will cause a drop-down to appear. Then select "Logs" at the bottom.
What does your appstat page look like?
A couple other questions... assume this is a fairly new C7 hub? What version of the platform are you running?
Yes, it’s new. 2.3.3.140
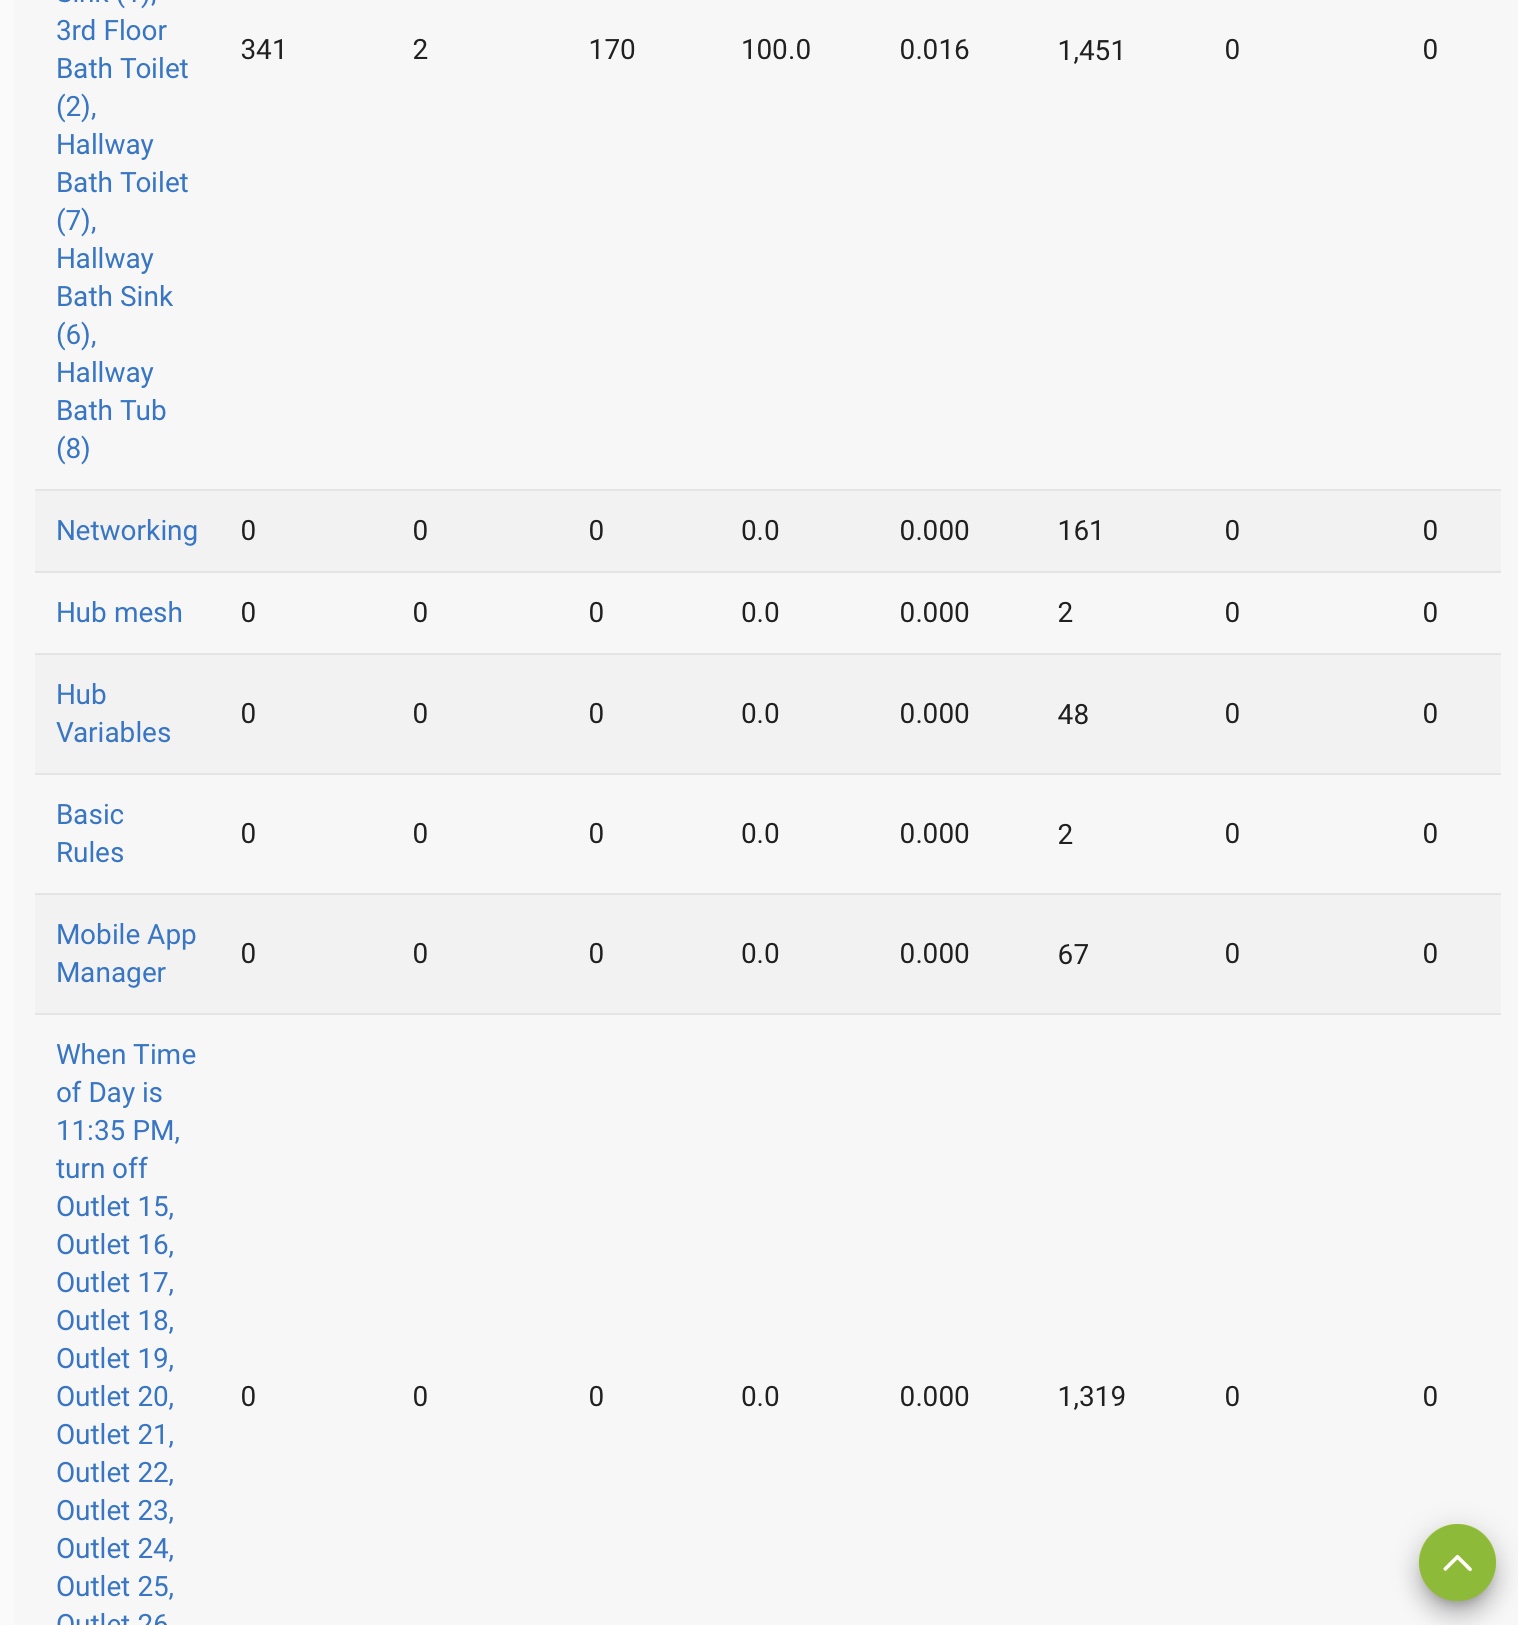
I can't really read it. You want the one with the largest total ms at the top. Can you do it from a PC based web browser instead? Not getting any meaningful information this way.
Agree, it is hard to read that way. I can't tell what lines up with what.
I am not as familiar with iPad as Android, but with Android (and specifically Chrome) you can use "desktop mode" to render a website. If you don't have a desktop available, this might be an alternative.
I don't think the individuals overly matter at this point given that total app and total device time are almost 0.
@user2930 looks like you rebooted so whatever was causing the issue has had it's stats reset. The next time you get the error, if it does happen again, grab those screenshots before rebooting.
It may also help to list what custom apps you are using just incase there are known concerns or best practices we can provide. Some apps can cause resource usage to go up a fair amount depending on configuration.
Download the Hubitat app