My Hub (#1) which has been running fine for about 2 1/2 months now suddenly started having periods of major slowdowns. The problem all started after adding a new ZW15R-1BW outlet. I added 3 of these at the beginning of the week and it caused no problems.
Today, I added the 4th outlet which happened to be on the same circuit as the hub. In otherwords, I had to shutdown the hub to install it. Once installed I restarted the hub and included the new device. I had to reboot the hub (unrelated reasons) and right after that the hub became almost unusable.
I should point out that the current slow down behaviour is exactly the same as I described earlier this week for my newly added Hubitat hub 2. New Hub cant Connect I ended up shutting it down overnight and the next morning all was well. I cant really shut down hub 1 overnight so I am looking for other options.
First thing comes to mind is to remove the newly added outlet but I have to wonder how this new device can create such havoc.
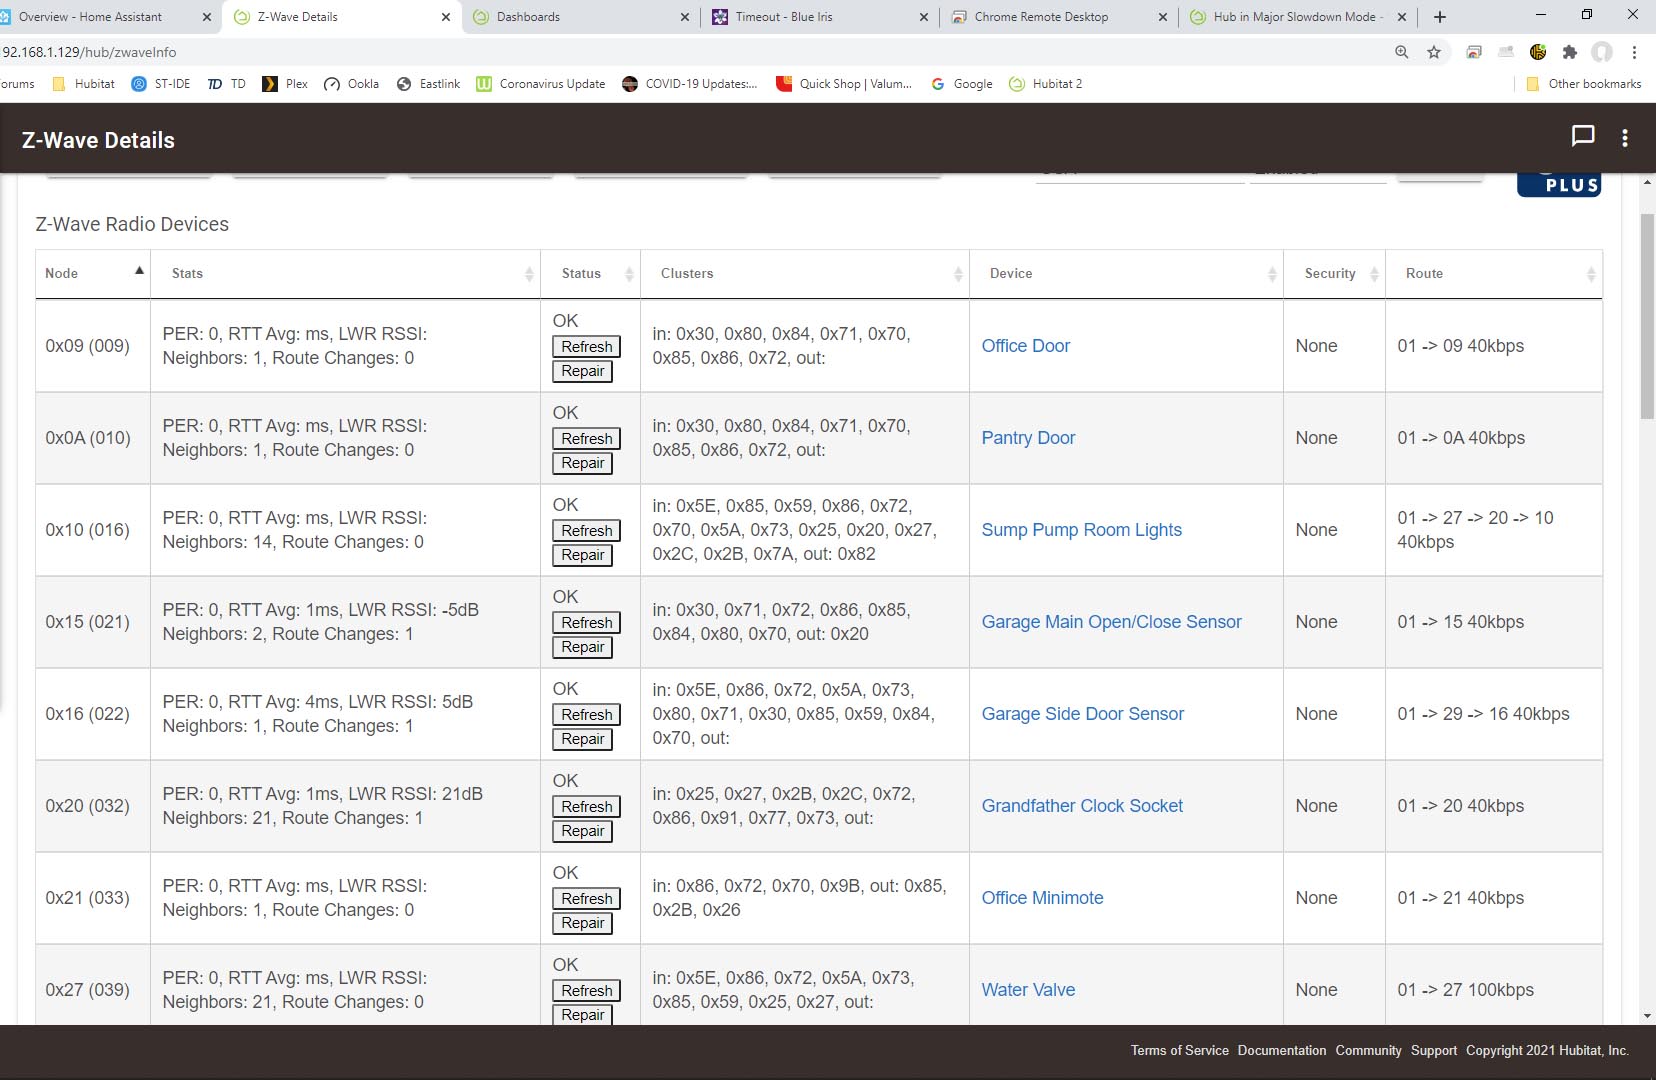
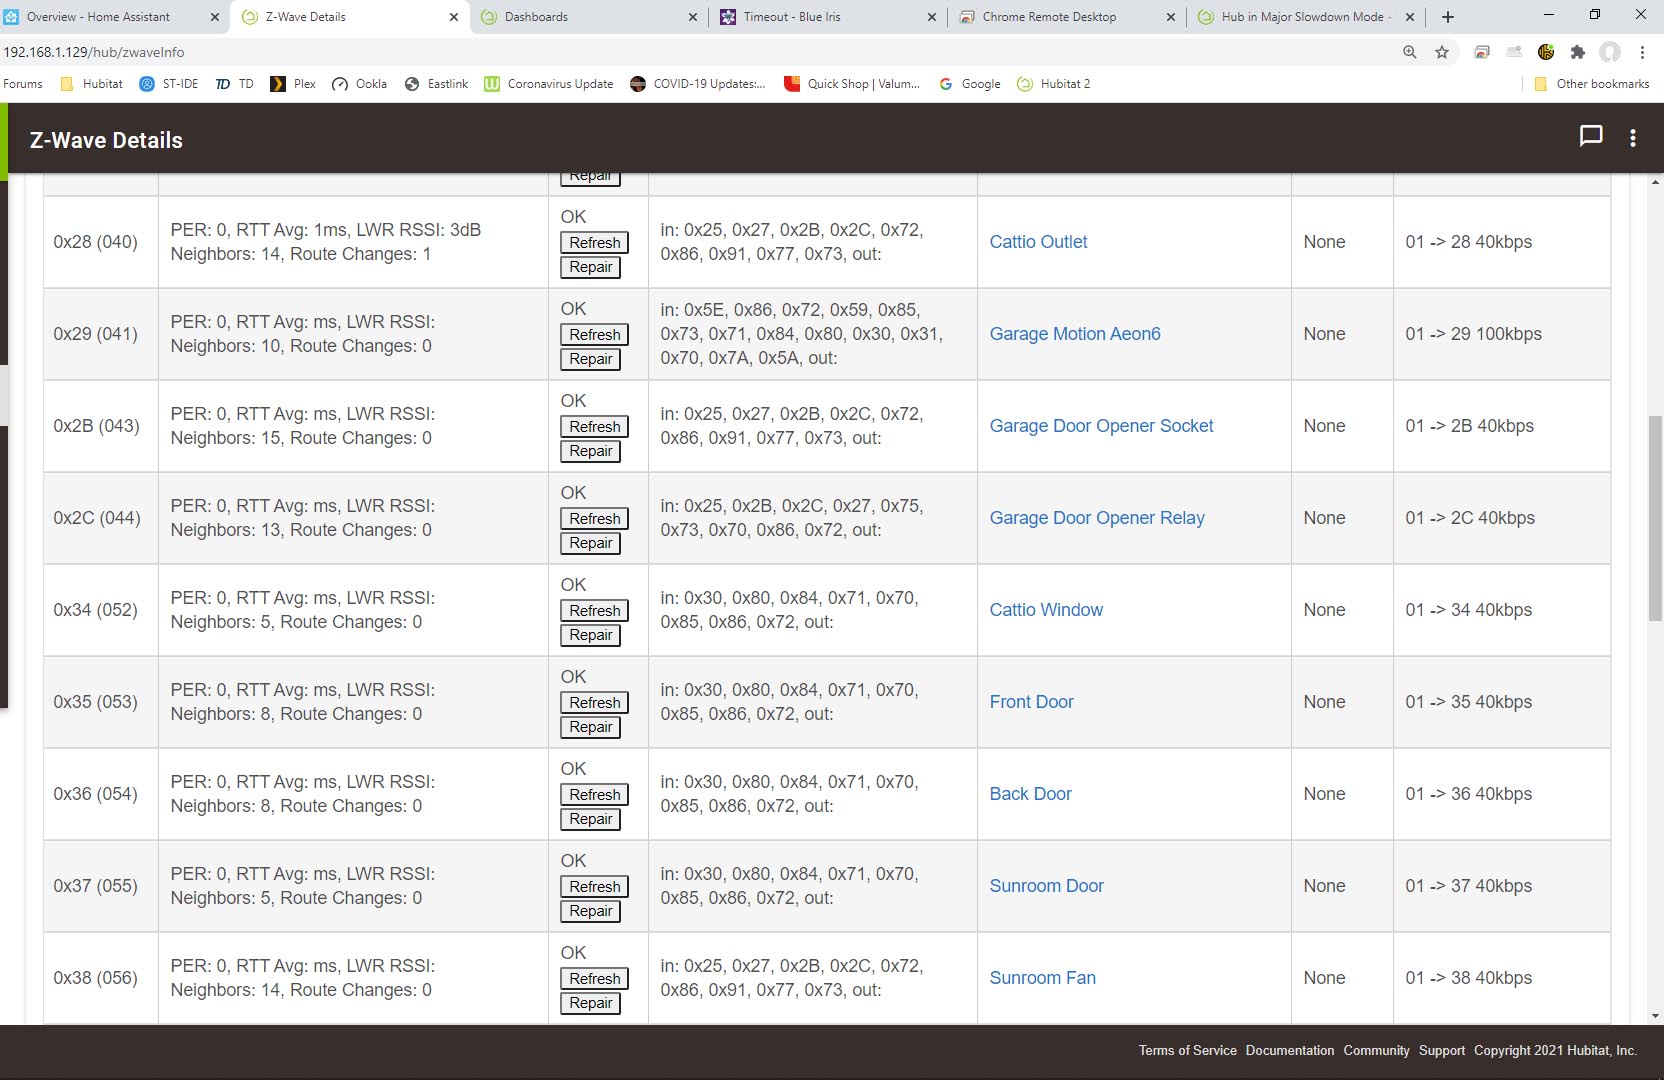
Looking at my zwave details page I see nothing unusual. There are no ghost devices.
I also have Hub Mesh enabled for the past few days. Didnt do anything with that today but who knows. What happens though if I disable the mesh. When I re-enable it, will my existing automation still work?
Try looking at the logs to see if anything unusual is going on - perhaps many messages all at once, perhaps messages repeated, perhaps errors in the logs, perhaps anything out of the ordinary....
Past/current logs, device/app stats show nothing unusual. What is odd though that the hub was restarted 3-4 hours ago but the device/app stats had next to nothing for usuage stats. The devices showed 13 seconds while apps showed 2 min, 13 seconds. I have been playing with the hub for several hours yet the stats dont show that. I reset the stats and now the uptime shows Uptime: 2255d 0h 10m 25s This is what it showed earlier and I rebooted the hub. I thought that solved the problem. Definitely something weird is happening here. The logs offer no clues.
Mostly our of curiosity but can you give us/me a feeling of what you are calling slow. And what functions are driving the slow action.
i.e. I have timed lights and when I see them go off and look at the clock it on the minute I specified. So if there was a 30 second delay I wouldn't see it.
How if I had a motion sensor turning on my lights, there I would notice any significant delay.
Again I'm just trying to relate your issue with what I see with my hub. Mostly to know if I should be looking into similar issues but have just not noticed them.
When clicking on a link either in the web interface or mobile app and the busy cursor spins forever until 1) finally loads the page. or 2) Error loading page.
When I try to load my mobile app (IOS or Android, no diff) and after a long busy cursor wait I get "Hub is not responding" (or something similar
When devices dont respond to such things as motion sensors, doors opening.
All of these things is sporadic. At any given moment all appears fine, then... Navigating the web pages is next to impossible, devices dont turn on/off when they should. In fact, I tried to run the Hub Shutdown and it just sat there doing nothing. A few minutes later I tried again and it shutdown immediately.
Logs past/current, app/device stats and system events tell me nothing. Everything appears normal.
After trying anything suggested and what I could think of last night I tried the unexplainable. I decide to once again shutdown the hub but this time shutdown the 2nd (meshed) hub as well. After 15 minutes I restarted the culprit hub followed shortly by the 2nd hub. Voila, everything is working fine. No more slowdowns. Is this a coincidence or what? I certainly cant explain it. Maybe someone else can
Have you set the ip address of the meshed hubs in the Networking section? I have found that even though I set it in my router, it wasn't always accepted by Hubitat until i made it static in Hubitat itself.
Yes, I set it in the Networking section as well as my router. That said, it sure does feel/look like a networking issue. Router log tell me nothing either
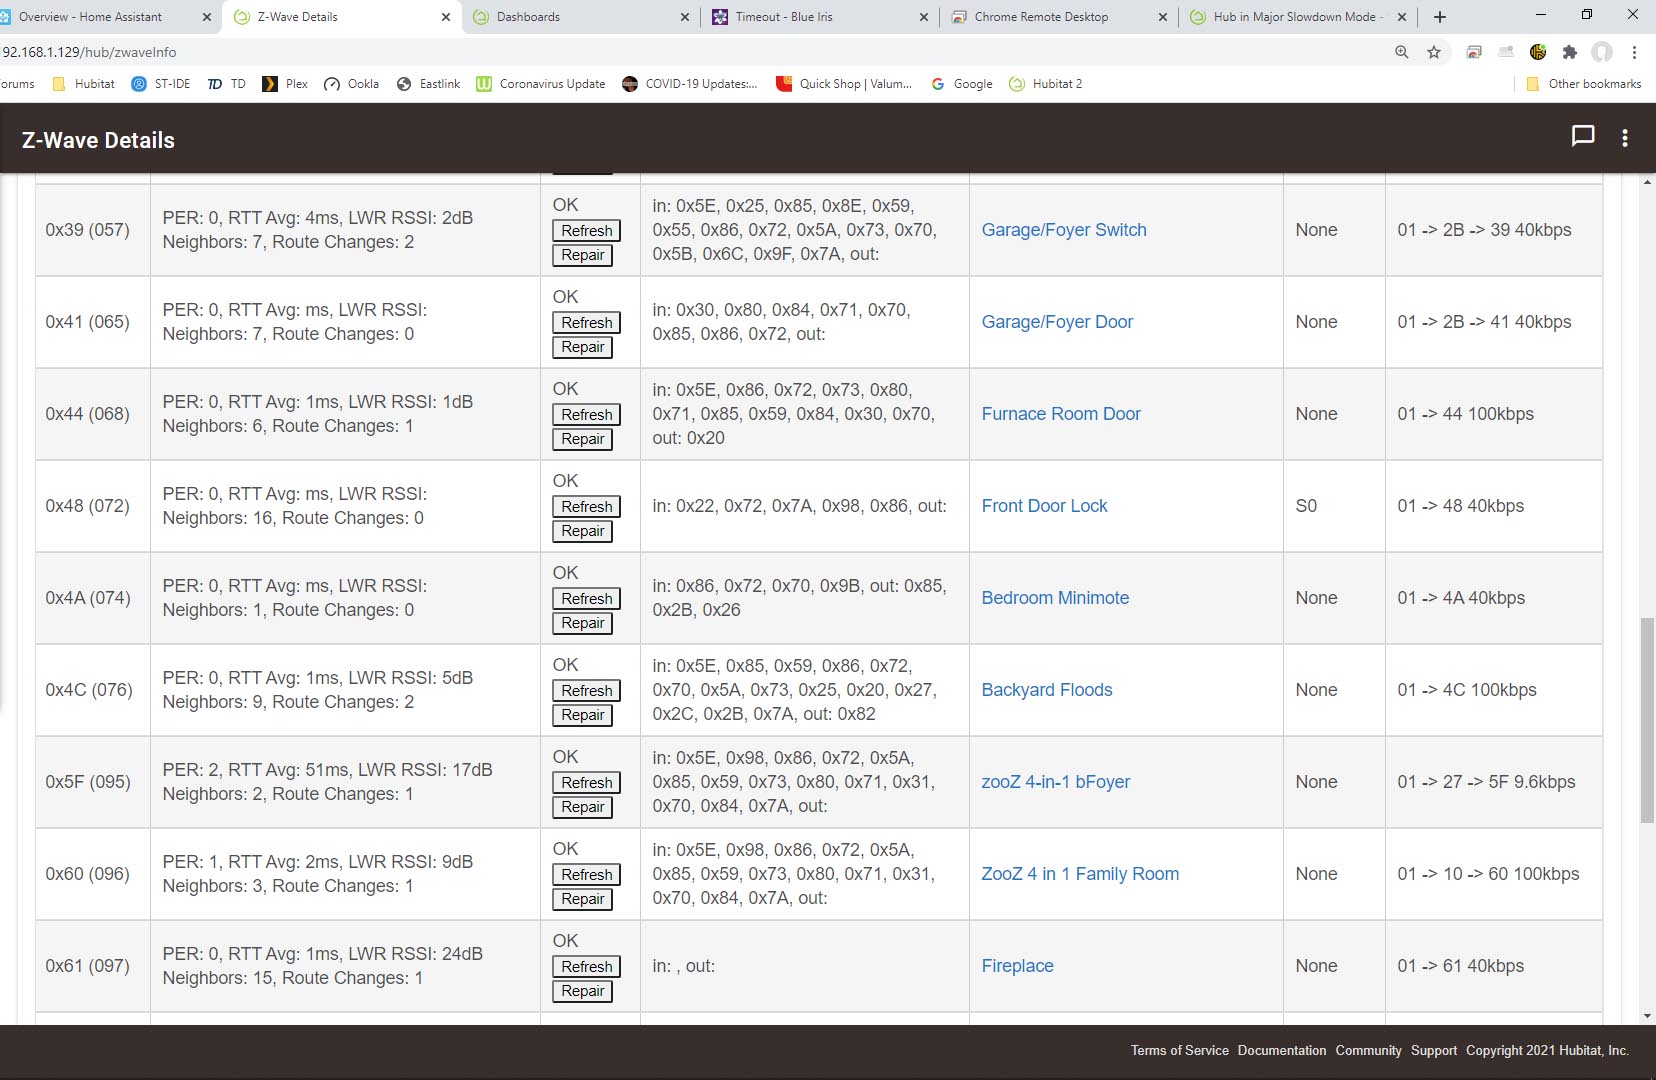
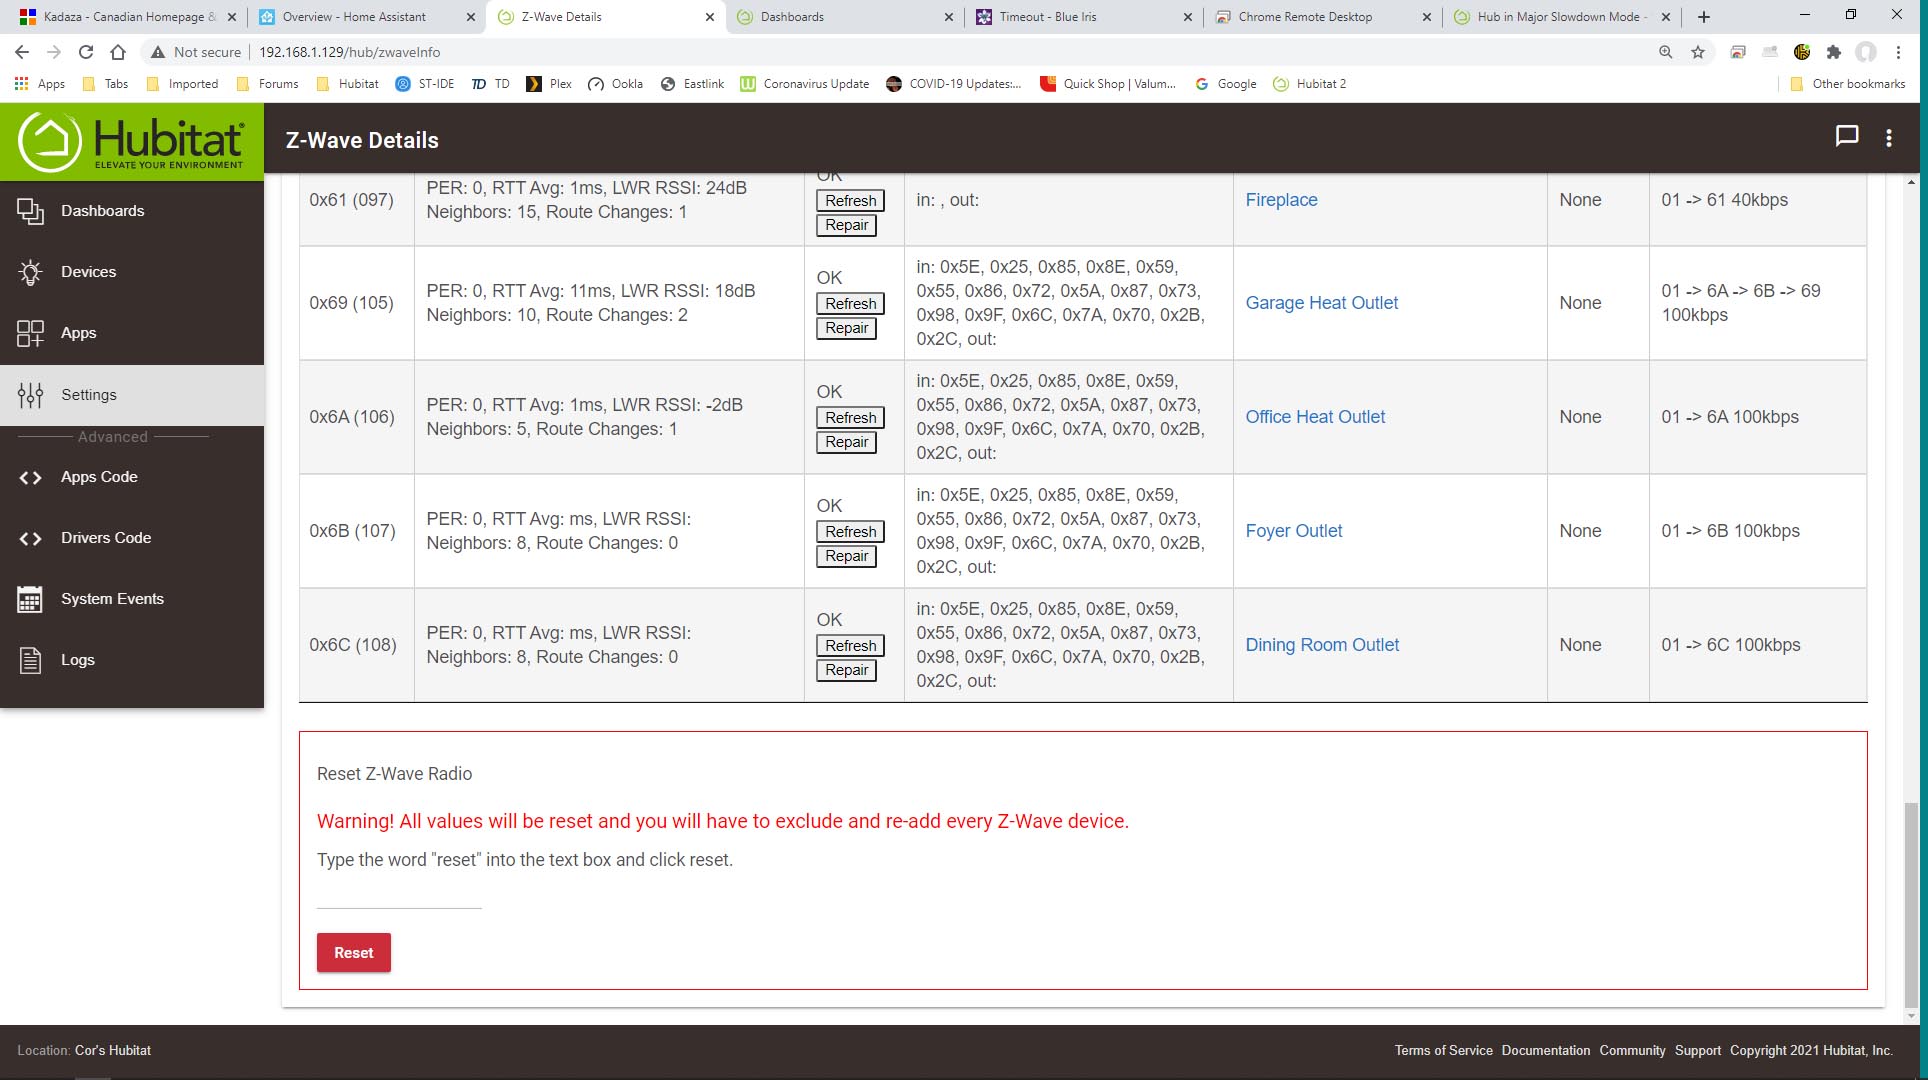
I did follow thebearmay advise and removed the Fireplace (0x61) which appears like a ghost device. Lets see what happens when I re-include it.
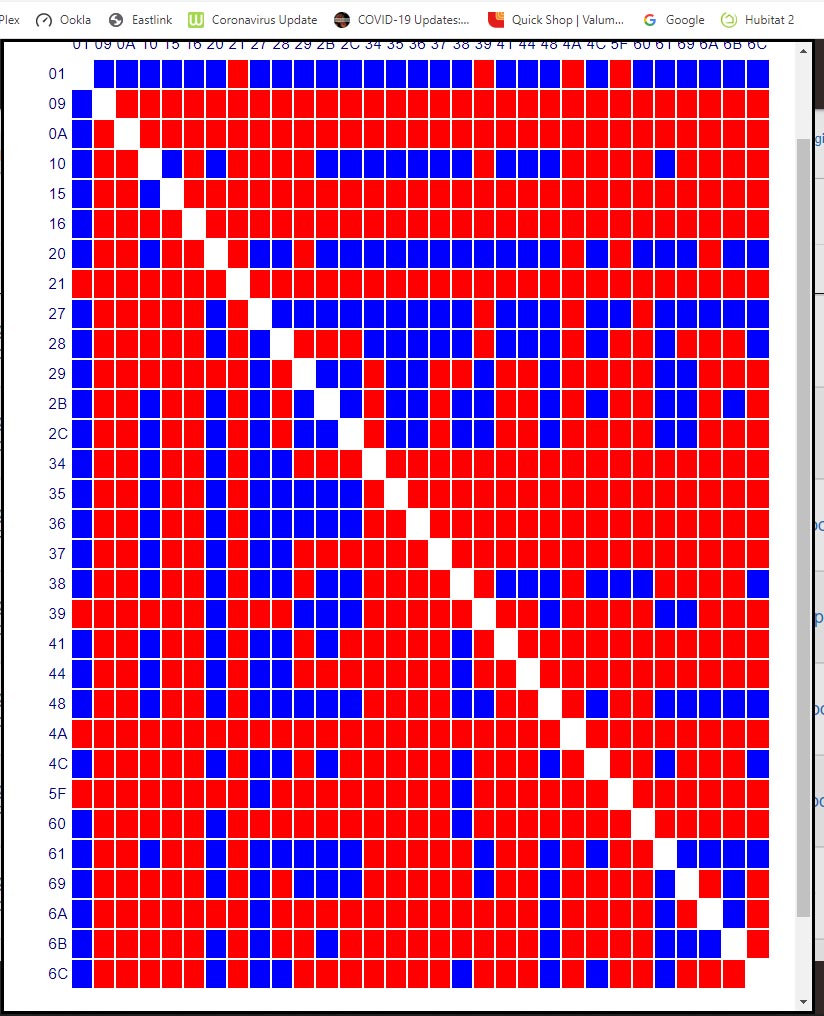
What does your Z-Wave map look like now? The one you posted earlier was horrible.
I'm surprised anything worked with that amount of red
EDIT: Didn't really look at the fact you have a lot of no hop connections so more red but still interested to see how things changed. I have mostly blue with a lot of mains powered (repeater) switches.
I don't seem to get the delayed device responses you describe but the delay on opening the main menu is all over the place from < 1 second to near 10 seconds.
I've been working on my browser cache deletions to see if it is some how related.