I'm looking to be able to log data, such as temperature from multi sensors, for later evaluation and graphing. So I install InfluxDB-Logger from the Package Manager, but it appears to require the IP address of a different system that contains the database.
Can the database be installed on the Hubitat so everything is self contained? If not, is there a self contained logging package?
If not, can the database be installed on a Mac that will do there recording?
EDIT: Can you link to the logger ap you are wanting to use? It may need some software on the system running infkuxDB, which may dictate where it is best hosted. The developer of the app may also be better placed to answer your question, posting on the topic for the app is more commonly where questions like this would go.
InfluxDB does need to be installed on an external system. People often run it on a raspberry pi or docker container in something like a NAS. I expect it can also be installed on a Mac, so would encourage you to investigate that.
Edit: This is not strictly true, as @terminal3 points out below, it is now part of webcore.
There was an old custom app called hubigraphs that could record data locally and chart it, but it is no longer maintained.
I think your best bet is to go down the route of running influxdb and something like Grafana on an "always-on" device like a Mac or rpi or NAS.
It is being maintained and it is now a part of webcore. You do not have to use webcore rule development to create pistons, the graph function is separate. You do need to install webcore, but it is now a built in app of HE so that part is easy.
The graph part is a update to the original hubigraph code with some improvements.
So, I'm a little confused trying to get graphing going. Based on recommendations I have installed Webcore and Hubigraph. But now, I can't figure out how to get started creating a graph
Once I get one going I'm sure the rest will follow, but what steps do I need to follow to get a simple graph of temperature history from a multi sensor that is already working in Hubitat?
You don't need both, just one or the other. Hubigraphs still works, but it has been abandoned by the original developer. Webcore added that code and it is now part of webcore.
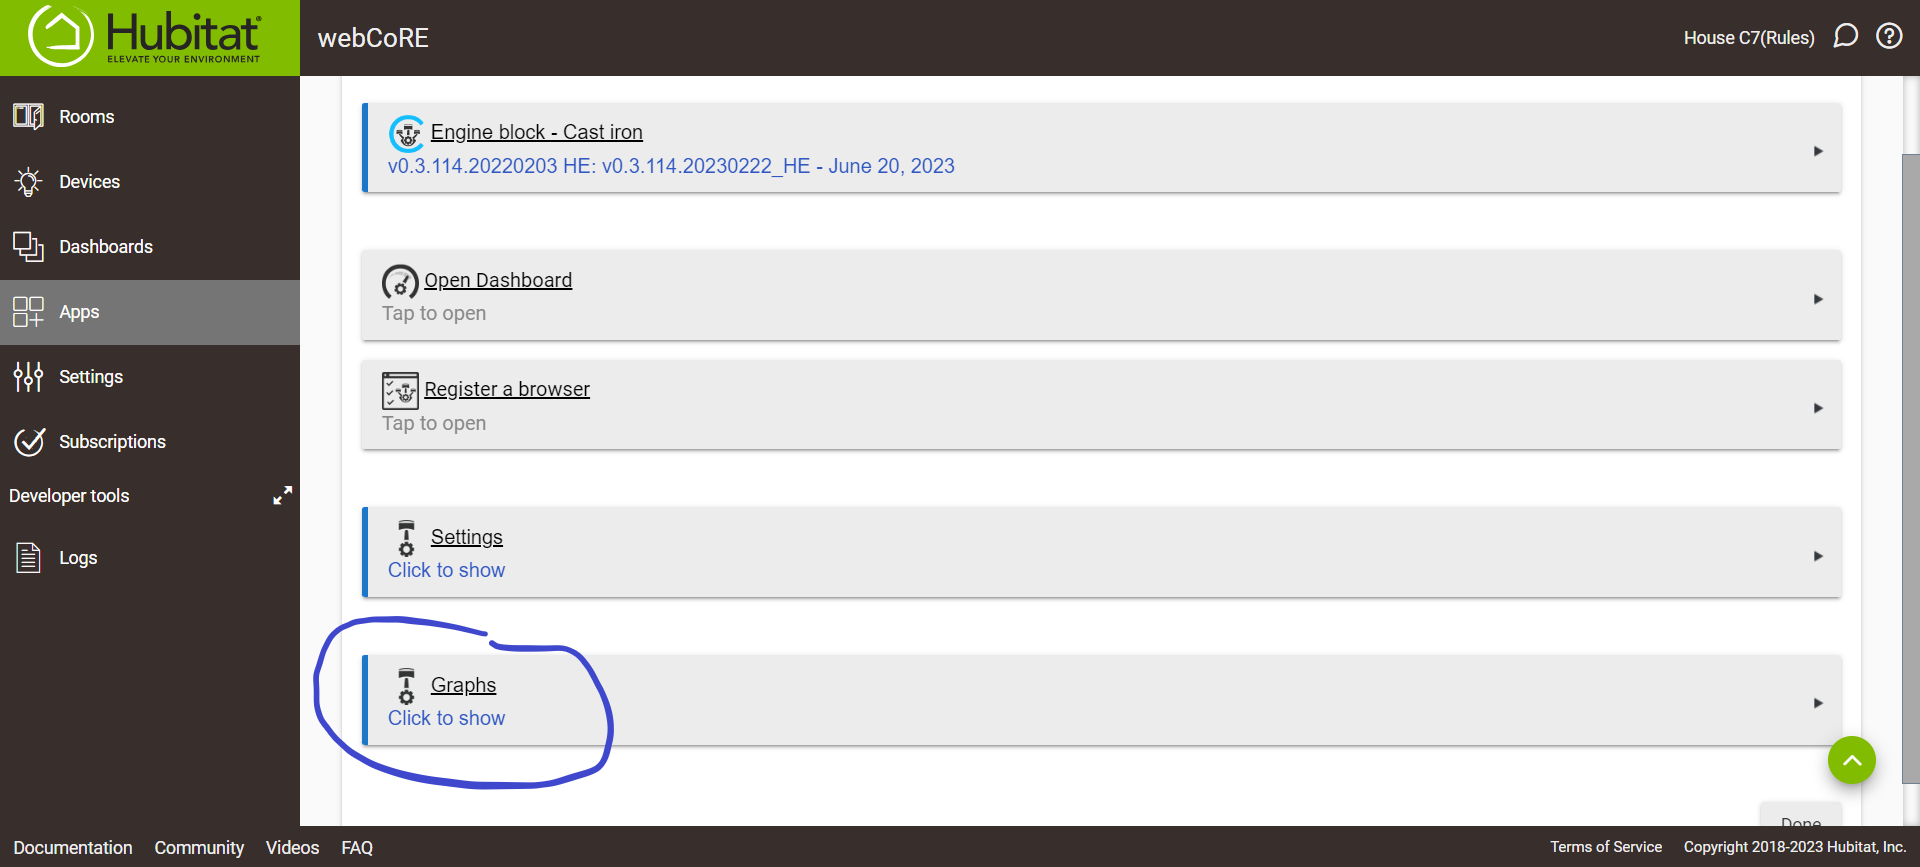
To create a graph in webcore open it and at the bottom you will see a box that says Graphs. From that point hubigraph and webcore are very similar.
If I'm only using Webcor, where is the logged data stored, and how can I keep track of the used storage space? (I don't want to risk filing up the HE's storage and running into problems.)
If it's the same as hubigraphs, the long-term storage should be visible as a file (or files) under the file manager page on the hub, available from the Settings section.
It is the same, there is a long term storage option, You should see it listed under the webcore header where your graphs and pistons, if you have any, are listed.
These files are stored on the hubs memory. You can store data up to a year out, The file format used by this newer version is a text based file that has the value and epoch time listed for each data point. You would need a whole lot of graphs to fill it up, as @sburke781 mentions you can look at the file manager section under settings and see how much space you are using. Also hubigraphs will estimate how big your file will be based on the data rate and time limit you use.
If you save a years worth of a power sensor data that is reporting every minute, well that might get pretty big. I have probably 20 graphs at this point and according to the file manager I am using less than 1 % of the total space available.