Hey guys -
I'm wondering what kind of response times you guys get for loading your dashboards? I have a bunch of dashboards with anywhere from a handful of tiles to upwards of 20 tiles and no matter whether I try to open them on Chrome under my Pixel 3 phone, or my iPad Pro, or on my PC, the average time it takes to open up a local dashboard is somewhere between 10 - 20 seconds. And often times on my phone, the cloud dashboards or trying to open a dashboard via the Hubitat app just shows a black screen and I give up after a minute.
Doesn't seem to matter much what devices the dashboard contains... some of mine are a mix of devices, one dashboard just had GE light switches, one dashboard just has Logitech Harmony activities.
Are your local dashboards "snappy" or is it normal for dashboards to take 10 - 20 seconds to show up? If that's abnormal, what could be causing the delay? Is there any way to troubleshoot this?
My local dashboard is quite quick usually less than 3 seconds.
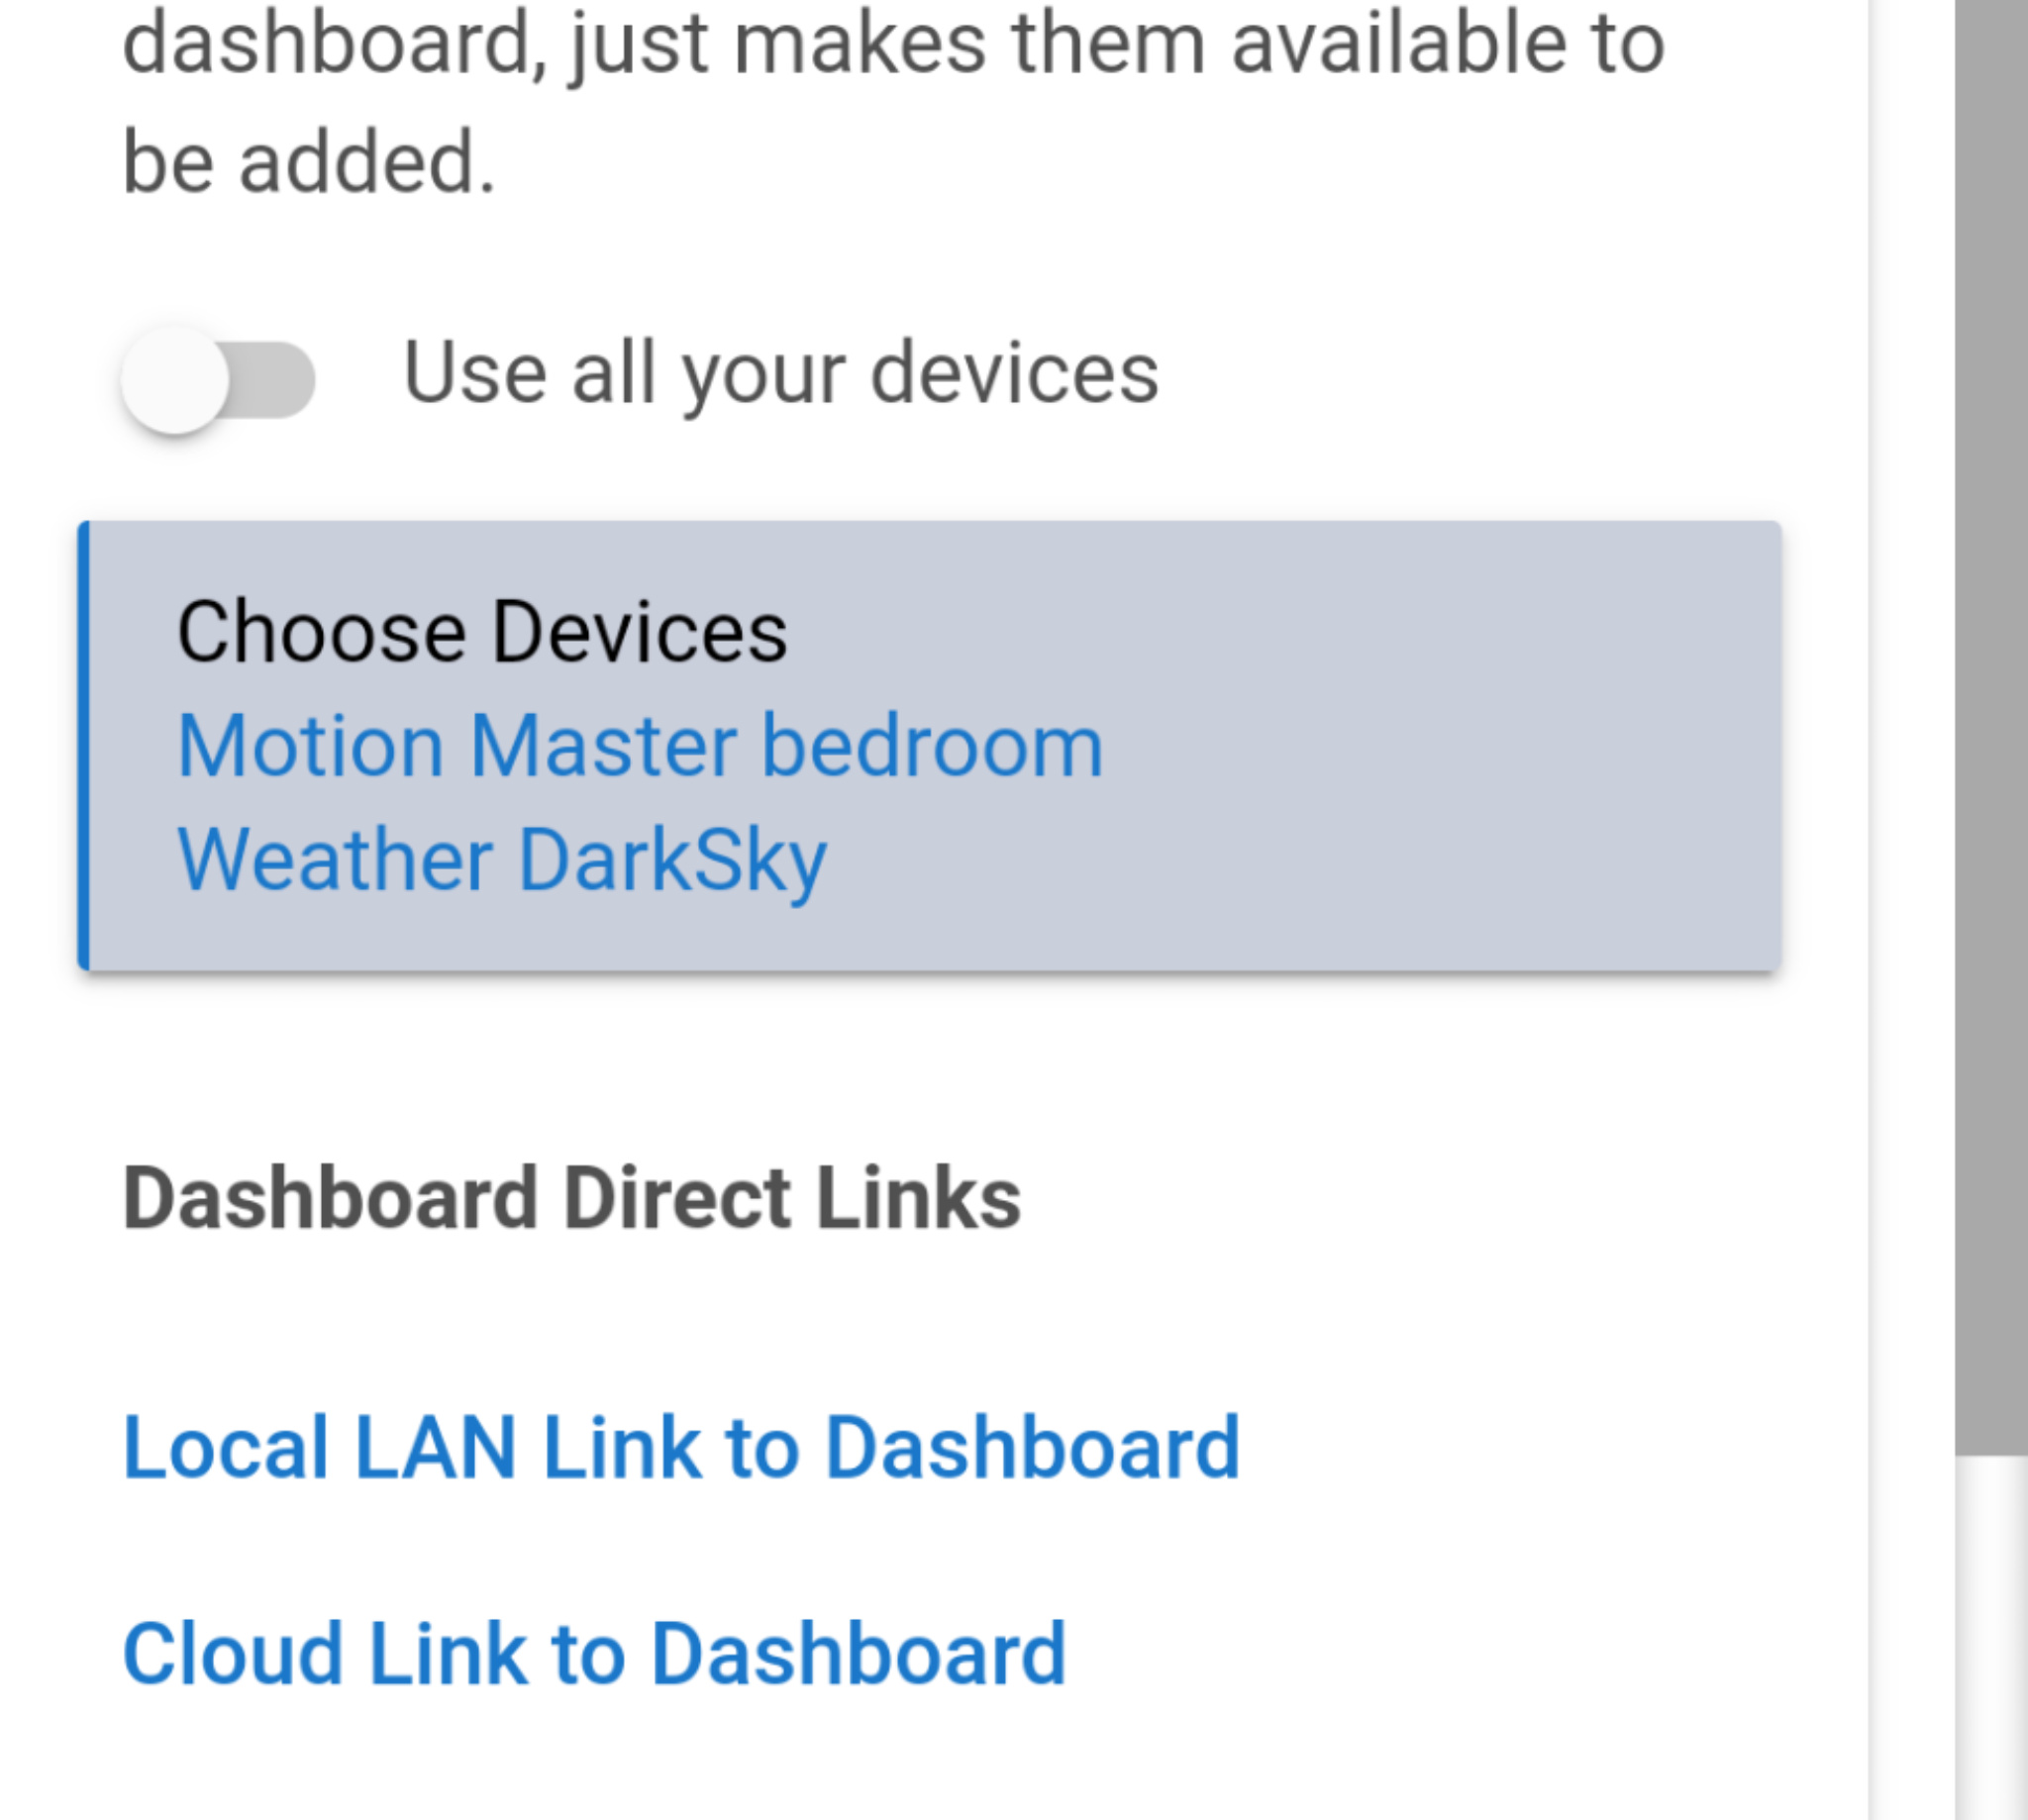
I find selecting only devices you want in the dashboard instead of all devices and if you are going to use background image. Try choosing a small size instead of big size one.
I'm not using any background images.
Is there a way of changing existing dashboards to only allow select devices instead of all devices or can that only be done when initially creating a dashboard? I'd hate to go back and re-create all my dashboards, particularly if it means needing to know ahead of time which devices to allow for each dashboard. Hope that makes sense.
It's under HE app/dashboard
2 Likes
Thanks, it's a little obfuscated that you can't get to the available device list from the dashboard itself, but at least it was easy enough to go back and toggle on only the devices required on each dashboard. That significantly sped things up on all my dashboards. Nothing is exactly instantaneous, but at least the delays are a much more reasonable several seconds rather than 10 - 20 seconds.
This is excellent information to know.