Which NodeRed/InfluxDB package are you using?
What are you putting it on. If it is a raspberry pi i have a image that I built for another thread here.
The direct answer is I used InfluxDB 1.8.10, with Grafana (latest), on a unraid server. The influxdb logger app i included above is now in HPM so you can install it that way.
It is possible to use Influxdb 2.x but it requires more work. @jtp10181 pointed me in the right direction in the thread i linked with my pi image. It just requires a little bit more work to setup.
The pi image includes InfluxDB and Grafana with the datasource already configured. I also loaded Node-red and NGINX under protainer as well.
so you go from HE right into Influx? I was thinking to offload the writing to Influx to NodeRed to lower HE's burden
Yes. Overall it doesnt hit the cpu to hard. Mine goes as high as 2-3% normally.
I have heard of using node red anf it may be a good idea for some non standard attributes. I use the Influx DB looger for almost all of it though
Using the Influx DB logger is the easiest way to set it up, but a lot of people send it to Node-Red via Maker API and then have Node-Red log it to influx. Either way HE has to send the info somewhere, so not sure if its saving anything. Filtering the metric you want is much easier using the Influx Logger app. I set mine up using Node-Red and I wrote a custom function to filter out junk and let everything else go to Influx. At the time there was some doubt on the Influx logger causing too much load on the hub but it seems like people are using it without issues now.
Already sending so much to NodeRed anyhows, figured why add more load to HE ..Ill have to poke around with this. Thanks much
What Influx version do you have? I can share my filter and converter to get the data ready for Influx 2.x
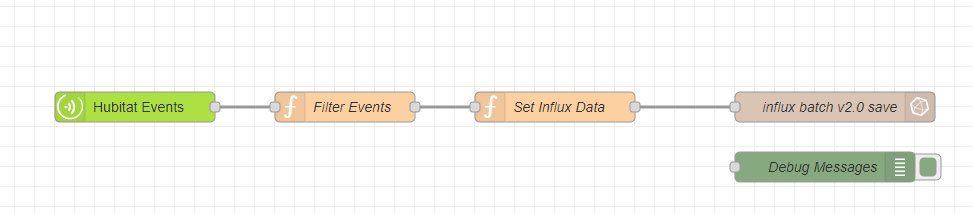
I exported it to JSON and removed some of the config stuff specific to my setup. You should just need to configure the Hubitat Events and the influx batch save nodes. For Influx 1.8, I started this flow from an example from another user on this forum, so their example has the code to export the payload in a format for Influx 1.8
If everything you want to log is already going to Node-Red then it is probably the best place to get it from. Doesn't make much sense to do that twice. InfluxDB logger does make it simple, but i suspect once you get the flow down Node red will do it with no more overhead to HE.
1 Like
I've had a good route around, but just checking - it appears to be still the case that there is no easy way to output sensor data to influxdb2 directly? Most are using Node-Red or something to translate? I have an influxdb2/grafana instance setup already for other things and would really like to leverage that if I can without adding more overhead/apps/intermediaries than I already have.
Just checking I haven't missed anything?
Thanks
Look around for the version of InfluxDb logger that supports influxdb ver 2. I have it on my development hub as i was testing with it for a while.
1 Like
Yeah if you dont want to setup Node-Red the influx logger app would be the way to go. There is a way to get the original version to log to InfluxDB2 via legacy mapping. I have instructions for it floating out on this forum somewhere. Or otherwise as @mavrrick58 said there is a custom version that someone updated to work directly with InfluxDB2
Below is a link to the fork I updated a while back. It has what at the time was the latest revision of Influxdblogger (ie the one in HPM) and then modified to support direct import to InfluxDB version 2. You can use token access to it.
InfluxDB-Logger/influxdb-logger.groovy at master · Mavrrick/InfluxDB-Logger (github.com)
The additional code used to create this fork was originally intended to support logging to a hosted InfluxDB instance. So it can probably do that to as well.
I have run both versions side by side and they seems to work as well as the original code, and iwth the new version.
Thanks all, a bit of fiddling around and I'm all sorted!
Is there documentation on how to refer to sensor values to write them to the local file?
I have devices with both temperature and humidity I would like to record to the file.
I can get the date and time written, but not the sensor values.
Thanks. I looked there, but didn't see any details on the write/append actions. I did find the info under special features/local variables. I had already figured out that I needed to put the sensor values into local variables first, then write the local variables, and use %date% and %time% for a time stamp.
I've had the influx db logger installed and working for some time, but one thing I've been missing is the hub CPU and memory, can someone describe how to get this data from the hub into influx using this app? Do I need to select access all attributes? Currently I don't have that selected. I do have log hub properties but it's not logging CPU or memory? Do I need the hub information driver installed separately and then select access all attributes here in the influx db logger?
ok, great, that's a start.
So what exactly does "log hub properties" in the influx-db logger do exactly, i mean, what properties does it log?
Nevermind, I answered my own question:
if (prefLogHubProperties) {
        location.hubs.each { h ->
            try {
                def hubName = '"' + escapeStringForInfluxDB(h.name.toString()) + '"'
                def hubIP = '"' + escapeStringForInfluxDB(h.localIP.toString()) + '"'
                def firmwareVersion =  '"' + escapeStringForInfluxDB(h.firmwareVersionString) + '"'
You can use the Access All Attributes option, or you can use a flow with Node-Red which i have seen being done.
Probably the easiest option would be to do as follows
- Install the Hubinfo Driver
- Install a second instance of InfluxDB Logger
- Setup it up with polling turned off, Write data every 5 min turn, off all of the switches for hub data
and then and use the "Access All Attributes" option. Then scroll down and only select the Hub Info driver. Select the attributes you want. Click on done - Now monitor it to make sure it captures the data and sends it to the DB
You may want a second instance because to prevent potential issues with your current one. Somtimes collecting data with the all attributes option can cause writing to the InfluxDb to fail if the data isn't mesurment, time based data. Becareful with string that include data but not mesurements.
1 Like

