I am at my remote cabin, and decided to check on my hub locally. I noticed that my temp sensor wasn't changing and then started to look at the log files and got really confused on what I was seeing for other devices too.
This is a small system, about 10 or 12 devices. Some wall switches, a plug in outlets and some temp and water leak sensors. All Z-Wave. C8 hub, just updated to the latest firmware 2.4.0.151. These errors were before I just updated, but I suspect the update did not fix it. But I really want to understand how to read these logs and what they are telling me.
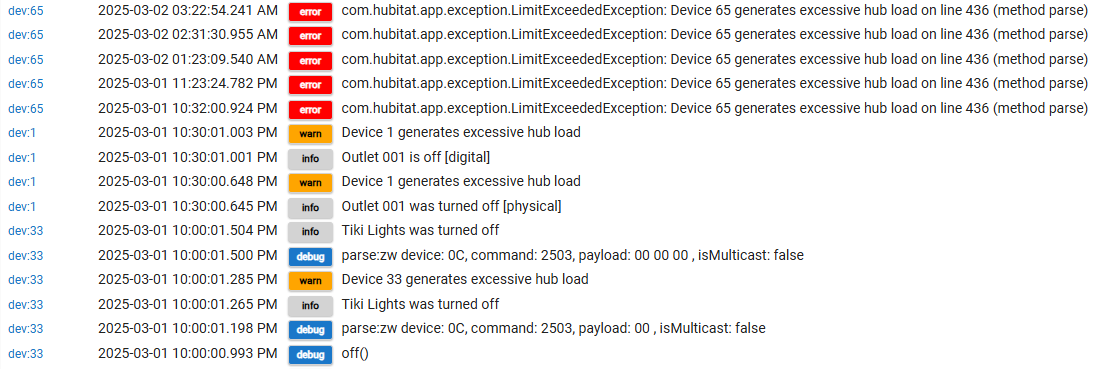
Device 6 is a zooz water leak detector. Device 1 is a plug in outlet, and 33 is a zooz outdoor plug. I have three wall switches, all Ultra Pro that are also showing the exact same errors. These are all just glorified timers, turning lights on and off at certain times and watching for leaks and cold temps. I have no idea what could be causing the "excessive hub load" every time a command is given.
Any thoughts or ideas?
First it is probably one device in particular that is triggering the event and the rest of the issues could be just fallout from the one bad device.
Have you clicked on the tab for app/device status. You may see one device that is holding allot of load.
Are your rules all based on events for triggers or do they run in intervals.
I was going to suggest a reboot, but if you just updated your firmware that will have taken care of that. You may want to do another reboot with the Advanced option selected and select the option again to do DB rebuild and reboot again. That will help if any bad data got in the DB.
It looks like you had multiple devices getting in a bad state and my guess is you had one device that went off the rails and it pulled everything down with it. Do you have any stats for this location for performance info. It would be interesting to see your Temp and CPU usage prior to this happening. My guess would be something created a race condition your hub couldn't get itself out of.
As far as what the stuff means in the log. The Log.warn messages are just saying a specific device is taking allot of time and cpu trying to process something. This is determined by looking at the time it takes for the system to process a method in the code. So for instance if the code to turn off a device takes a lot longer then it should it could generate that error message, The question is why is it doing that. As far as the Logg.error messages for device 65 those point to a particular method, in that case "PARSE" to apply a update.
Monitor how it runs for the next few days to see if it reoccurs. It is entirely possible you hit some combination of events that tanked your hub, or a bad DB entry got in that caused it to get into a race condition. It is hart to know from that small snippit of log info what triggered the event as all that logging is about the result and not the cause..
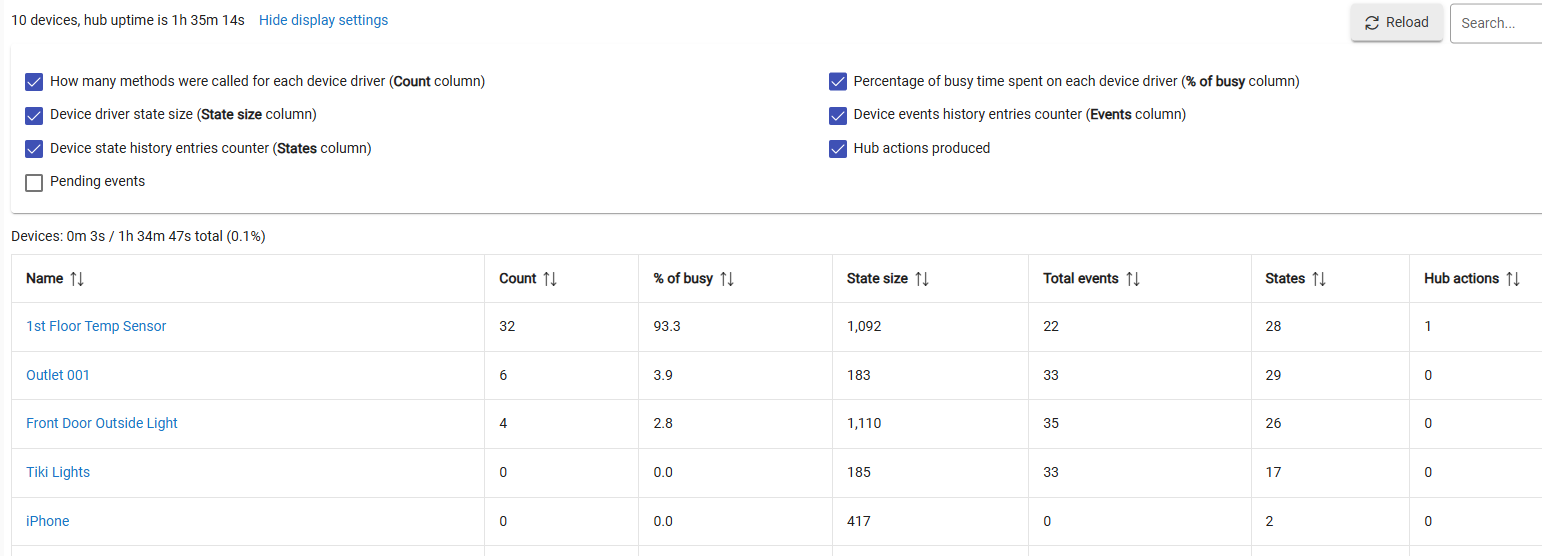
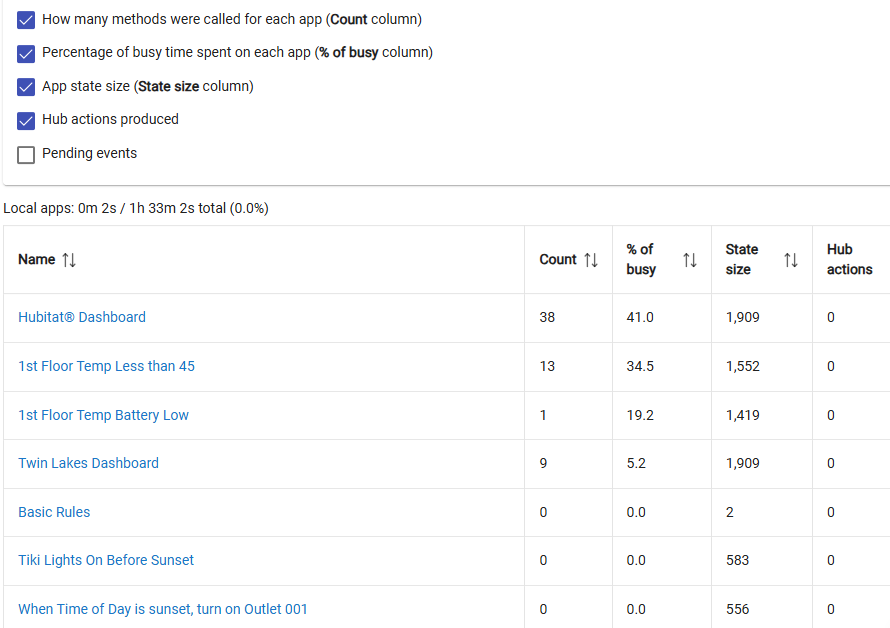
Here is the Dev stats and the App stat. It looks like this is since updated/rebooted. The front door and the outlet, I triggered and the temp sensor, I moved outside for a while and then back in to force a change. I also changed some of its parameters. So I don't know if these numbers are bad or not. Is the "pct of busy" compared to time in general - meaning that 93 pct of the last 1. hours its been doing something with that, or is it a relative term in some manner?
All of the lights are basically on a twice a day schedule, The sensors look for a low/wet value and then trigger a notification.
a misconfigured temp or power sensor can do that.. that log doesnt show it but you changed the parameters if the temp sensor was sending miltiple events per sec it can easily bring down a hub.. what did you change..
I changed the change trigger from 2 to 1 deg
Reporting interval to 120 minutes from 240
changed the wake up interval to 6 hours from something larger.
I did that after the update/reboot just to see make it update a little more often and the force a reconfiguration.