Help diagnosing a freeOSMemory issue

Ever since I upgraded to 2.3.0.133 on 11/28/21 (from 2.2.8), my system has been consuming memory. The system performs well otherwise; fast responses from all devices and rules. The logs for App Stats don't show anything that looks out of the ordinary (to me at least). The main thing I've noticed is that device Events are piling up. Are events stored in OS Memory? If so. that would be one explanation why memory is being consumed.

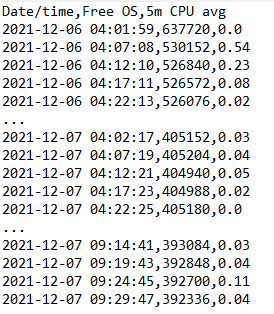
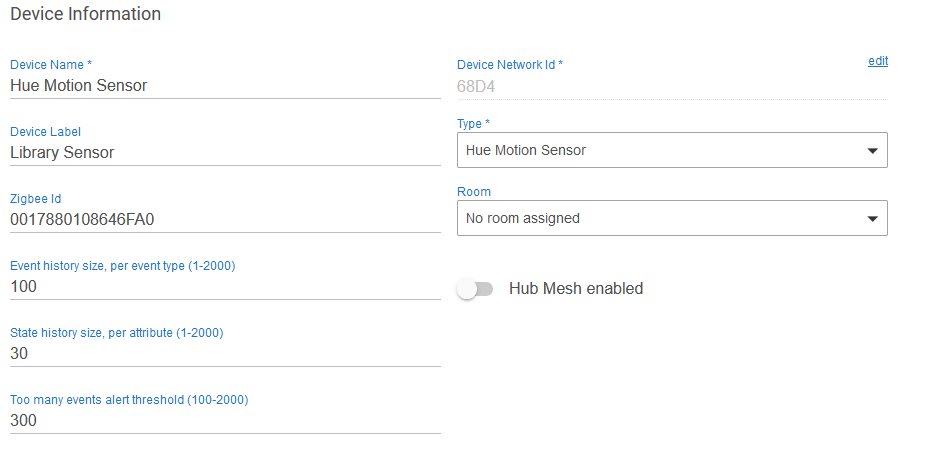
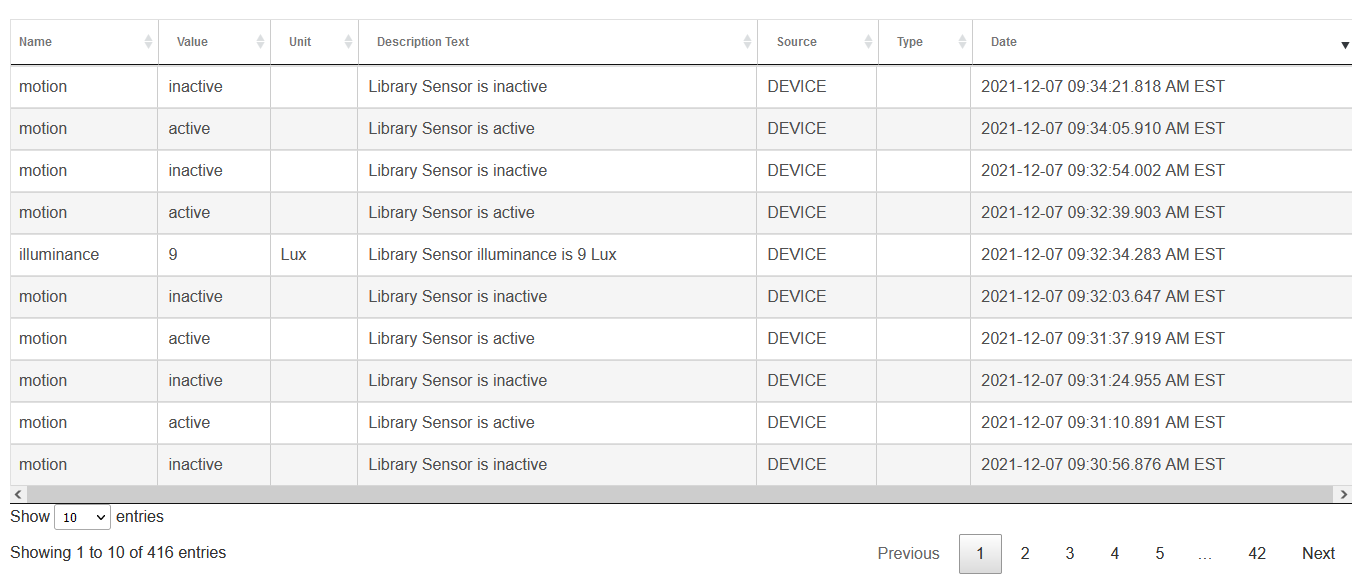
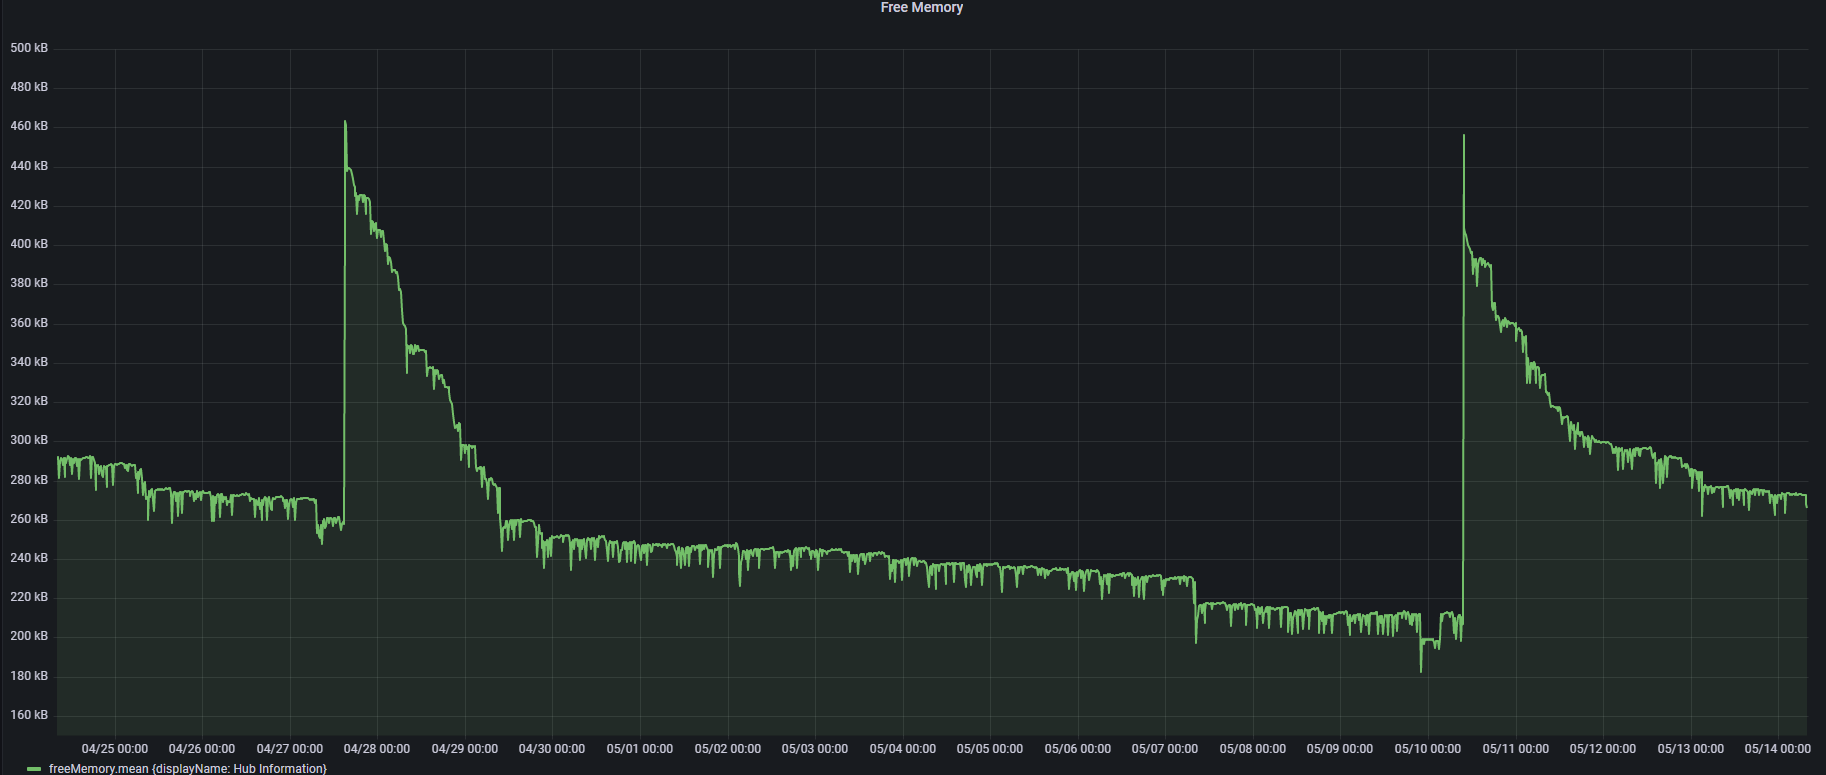
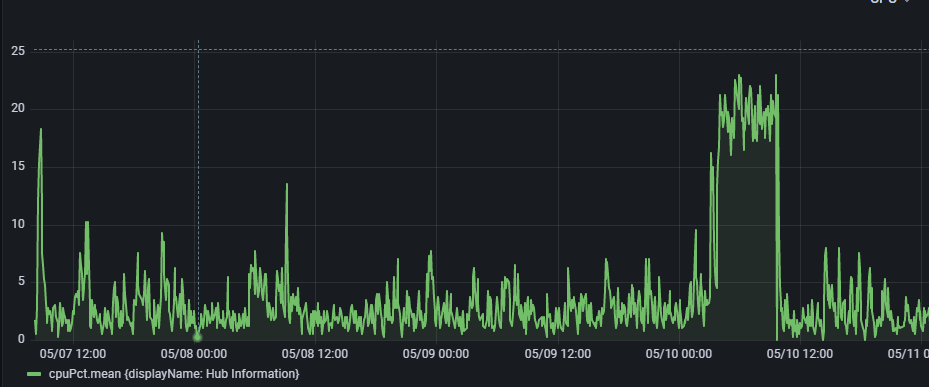
I've checked the settings for Event History and they're all set reasonably low, but the system doesn't seem to be obeying the setting (as I understand it). Below is a snippet of freeOSHistory showing the decline and an example Device Information setting (for 100 events), and the Device History showing 416 recorded events and rising.

Any help in diagnosing this would be very much appreciated.

memory


Thanks that makes sense. The Hue Motion Sensor reports 4 states, so I would think the limit would then be 400 events, but it's going higher than that. Interestingly, I have 9 of these. 4 are limited to 100 and the other five are limited to 20. I have never changed any of these values. The other 3 that have 100 for a limit have stopped at 400 events.

More important to my memory issue, could these accumulating events be contributing to decreasing free memory?

If I can be a bit upfront for a moment, why do you need hundreds of events for a sensor? Do you really go back and study that data?

I find it makes the hub run better if you aren't storing literally thousands of things you will never look at again. Things like weather, TV/DVR apps, and some thermostat apps have dozens if not hundreds of events, and at hundreds of events each, they can fill the database up quickly. As an example, I set my weather apps to be 3 events. Essentially yesterday, today, and tomorrow. My Tivo app is set to 1, why do I care what I watched yesterday or even earlier today? However I do keep a bit longer history with locks.

I would suggest making a couple changes.

Set events and states to 10 or maybe 15 at most, especially for very active devices or devices with multiple parameters.

I set these to 14 days as I don't need to look back months or a year in events. You might try just taking it down a bit from where it is at (I think it defaults to 365 days?)

  • yourHubIP/hub/advanced/maxDeviceStateAgeDays/xxxx
  • And yourHubIP/hub/advanced/maxEventAgeDays/xxxx

Thanks neonturbo. I'll set them to 10 and 10, reboot and see what happens.

For what it's worth, regarding my unresponsive hub issue from last week, after contacting Zooz, they concluded that I had received 500 series 4in1 units which would explain why nothing worked.

1 Like

I set the Event History Size and the State History Size both to 10 for all devices. That cut my dbSize in half, but didn't help with the declining memory. In retrospect, I guess that's the expected result.

I've spent some time analyzing the delta between the hub's reporting interval (5 minutes) as reported by freeOSMemoryHistory. The average delta is a 363 (kb, I assume) decrease which seems substantial to me over a 5 minute interval. I took a closer look in the logs for the intervals that exceeded the delta, hoping something would stand out, but there's nothing significant with the exception of the Echo Speaks - WebSocket Connection device, but that wasn't consistent. However that may have been masked by memory recoveries which happen quite often.

I guess my next step is to disable the Echo Speaks package. Will disabling just the WebSocket device do it? Or do I need to disable all of the Echo physical devices and the App?

Finally, any other ideas on how I can diagnose this?

Have you somehow found a solution?

No. I spent quite a bit of time analyzing the decrease, but never came up with anything. After a week it drops to 25000 so I have a rule to automatically reboot once a week. I have second hub that exhibits the same behavior, but it is very lightly loaded. It has currently been up for 39 days and is only down to 27500.

1 Like

@gopher.ny is paj418's hub something you want to look at for memory stats? :point_up: :point_up:

I know a while back you were analyzing these, and this user seems to have lower memory than I have been seeing reported by other users.

@paj418, which firmware version are you running?
Updating to the latest would be the first step. Keep in mind that memory reporting in 2.3.1 changed so the numbers are not comparable to earlier versions, although the numbers 2.3.1 reports are more useful and more reflective of what's going on.

2 Likes

Firmware 2.3.1.129. After reboot, freeOSMemory is around 60K, Drops to less that 50K after an hour or so. Then steadily decreases to ~25K after 7 days when reboot is scheduled. Same with the second hub, but it takes much longer to get to 25K (about 2 months.) Hubitat Package Manager and Hub Information driver are the only apps/devices in common between the 2 hubs.

Main hub is been up for 3 days, 4 hours. freeOSMemory is down to 289504.

1 Like

Can you update to the latest 2.3.1? The free memory metric was tweaked throughout 2.3.1, and the final version's number ends up being more reflective of what's going on with the hub.

Sure, but I'll have to wait until my automations are more inactive. I'll get back with results after I update.

I'm on 2.3.1.137 and I found a similar behavior! (I know that there is already 2.3.1.142, but the change log indicates that it doesn't change anything relevant.)

My Hubi stats after the last reboot:

Date/time,Free OS,5m CPU avg
2022-05-01 09:17:15,551036,0.0  <-- after the reboot
2022-05-01 09:22:21,427076,0.49 <-- after consolidating
2022-05-01 09:27:24,427476,0.38
...
2022-05-02 09:58:10,394776,0.0
2022-05-02 10:03:12,394652,0.0
...
2022-05-03 09:59:48,376700,0.02
2022-05-03 10:04:50,375916,0.01
...
2022-05-04 09:56:11,336724,0.03
2022-05-04 10:01:13,343556,0.01
...
2022-05-05 09:58:11,314072,0.03
2022-05-05 10:03:13,325628,0.01
...
2022-05-06 09:55:29,304868,0.04
2022-05-06 10:00:31,305988,0.03
...
2022-05-07 08:51:42,267868,0.02
2022-05-07 08:56:45,266672,0.03

Never before (running Hubitat for about 2 years now) I had such problems - IMHO it started only around 4 (?) weeks ago.
FYI: I haven't installed any new apps or drivers - apart from the usual updates (via HPM, or Hubitat itself).

BTW: Where can I see, who exactly (app, driver, system) is consuming all this memory?

Under the Logs tab there are additional breakouts for devices and apps that will give you insight into which are consuming the most runtime, and their percentages - nothing will directly say memory though. Also should note there has been a change in recent versions in the free memory calculation to make it more accurate so some of the variation may be that (should really consider .142 to for that reason if nothing else).

2 Likes

That's a pity. :thinking:

OK, update is running...

I have been running 2.3.1.142 for about 1 1/2 wks now and the problem persists. Last reboot was Monday @ 4 AM. Uptime is 5d 3h. Memory is down to 255108 and decreasing steadily. I'll need to keep to my reboot schedule

1 Like

Iโ€™ve moved my low memory warning down to 190K. Still playing with it to see where the bottom really is but was at 195K and still running smooth before one of my โ€œtestsโ€ went a little sideways and wiped out about 50K.

1 Like

I was looking through all this to find where the actual problem is. Is there some sort of problem or just a concern about the memory getting low? Free memory is wasted memory...

My hub after about 12 days was getting down to around 200k. I noticed a steady and higher CPU load as well but I could not figure out why. I saw in the logs the ZigBee radio was flipping on an off. Not sure if any of this was related or not so I just rebooted. Waiting now to see if the same happens again.

Here is the CPU spike before I rebooted

1 Like

If the zigbee is flipping on/off itโ€™s time to reboot. Hub shuts down the zigbee radio when under stress.

2 Likes

Yeah I think I had seen that somewhere else. I really wanted to figure out what went out of control and was eating the CPU but I could not figure out any way to see what was actually using the CPU this moment, just historical stats. Need htop or task manager.