ok so I have added influx and Grafana to my Home automation tool kit because I am waiting for my new devices to arrive and you know guarantee and I am a geek.
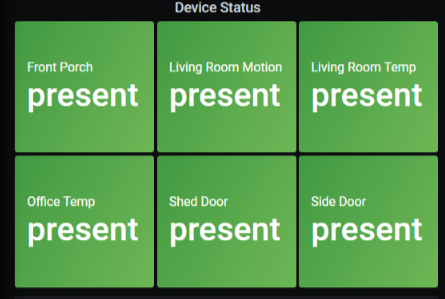
I want to create a simple panel green dot when device report present and red Dot when it isn't. I am certain this has been done before and am currently digging through google searches.
Anyone have any recommendations?
Thanks in advance
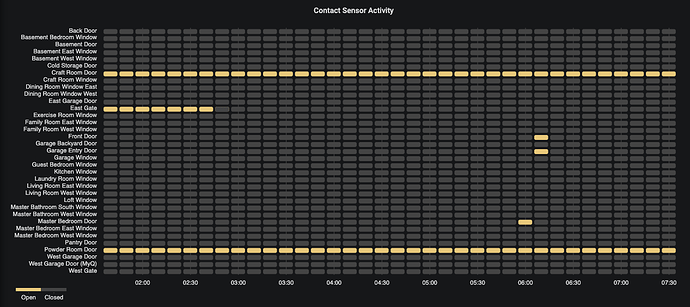
You might want to look at Statusmap to report historical presence data.
I got this working using the stat panel

If you are just looking for current device stats you can do this with a simple Hubitat dashboard. The advantage of exporting to a database is being able to review historical data.
Status map works well for motion and contact sensors.
1 Like
I have a measurement that is one of 2 states present and Not present I want to color code the background based on those values. Threshold seems to only work with numbers. I am sure there is a workaround but I haven’t been abl;e to find it
PS posted this on grafana forum as well if I get a response there I will share it here
thanks in advance
If you are not married to Grafana/Influxdb, HubiGraph can do this with either a Bar Graph, Heat Map or Timeline. All those graphs support non-numerical values.
honestly trying to keep load of my hub as much as possible...
So... that is one of the points of HubiGraph. Once the graph is loaded (on the panel) or otherwise, all the processing and updates are done using the endpoints already provided. If you refresh the webpage manually, yes there is a database hit. But otherwise... my Dashboard is running 7 graphs. I reload once a day (due to Fully Kiosk issues). The load on my hub is zero.
I’ll also say, I have run a real-time graph with sub-second updates. No hub impact.
Ok I got it working using a combo of valueBinary, thresholds, and Value Mapping


