Grafana Power Monitoring

Any Grafana experts out here?

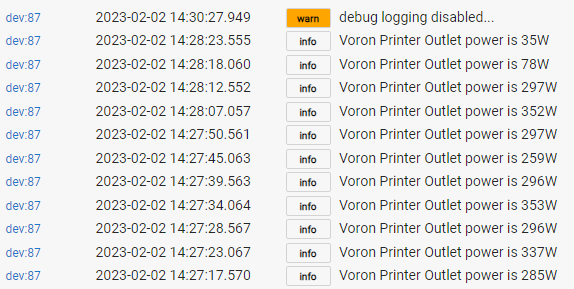
Just got my Sengled outlets and I'm testing power monitoring using my Voron Printer as a test bed.

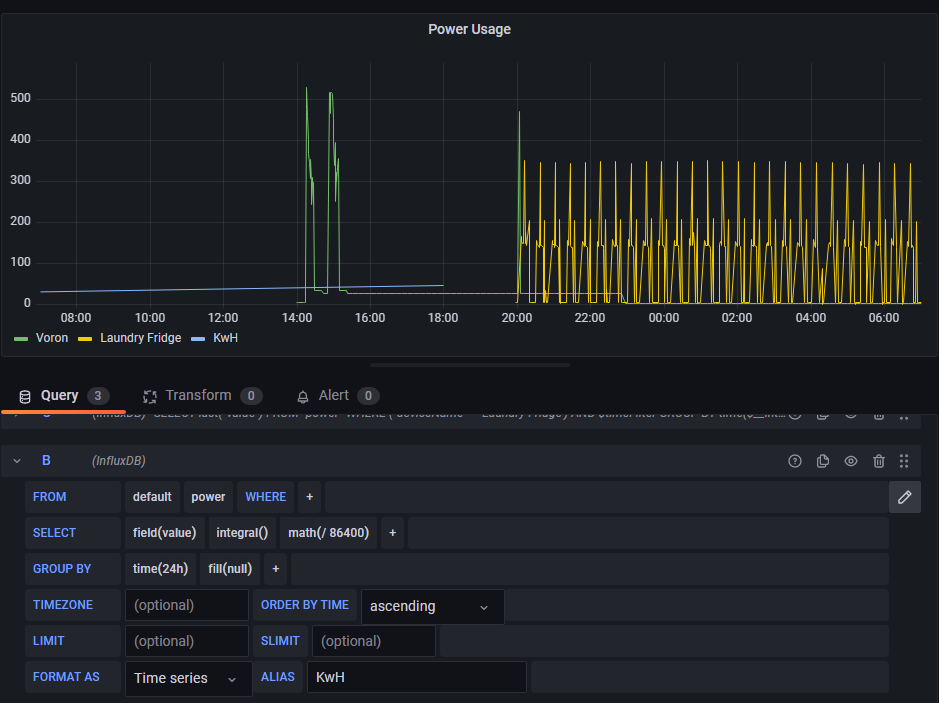
Looks like I have power reporting working, and I have it logging in Grafana, now just need to know how to add a panel in Grafana to convert this wattage to monthly KwH.

Any takers wanna help?

Here's what I have so far:
image

image

Grafana user here, but with Prometheus as a backend instead of InfluxDB. I just did this yesterday, I calculated the average over time, multiplied by the duration.

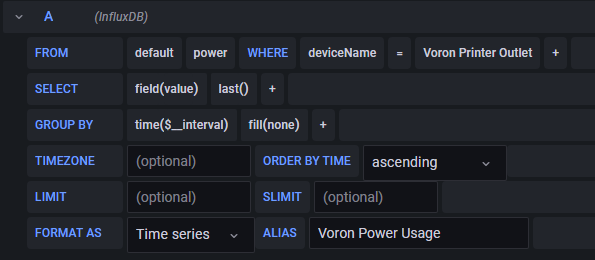
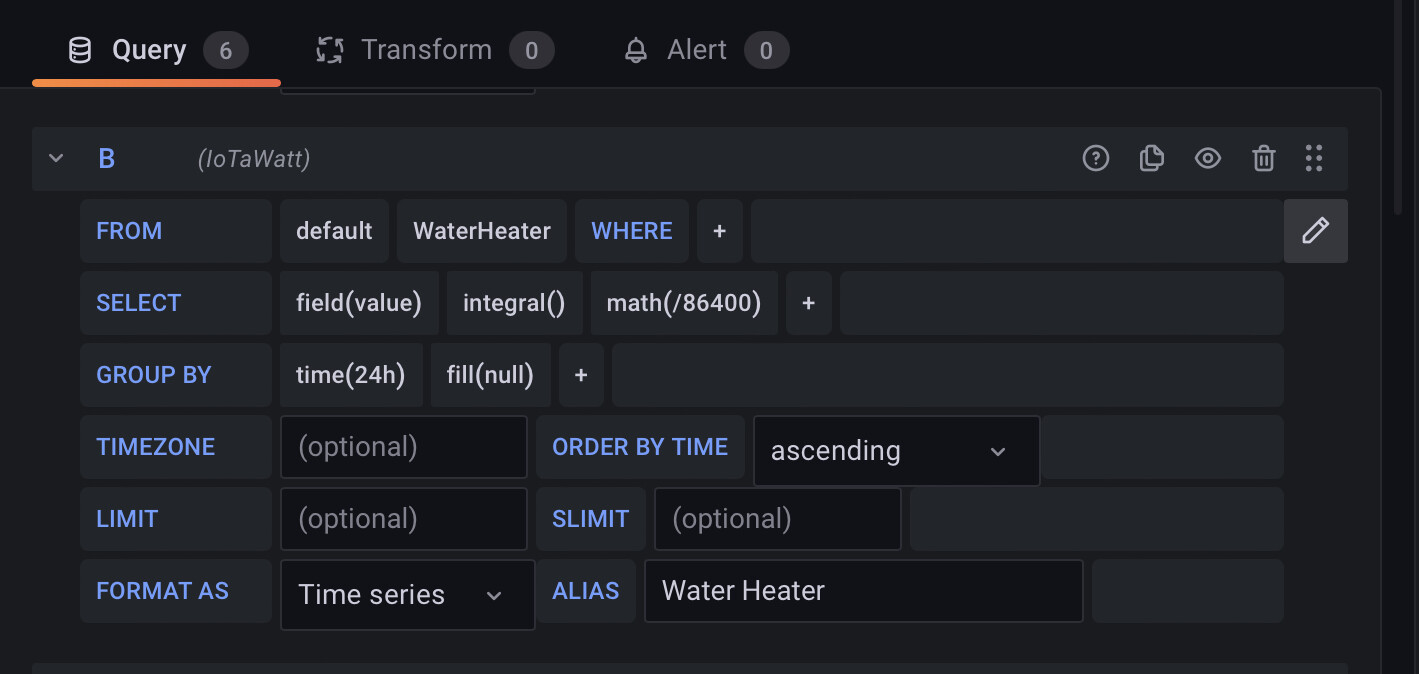
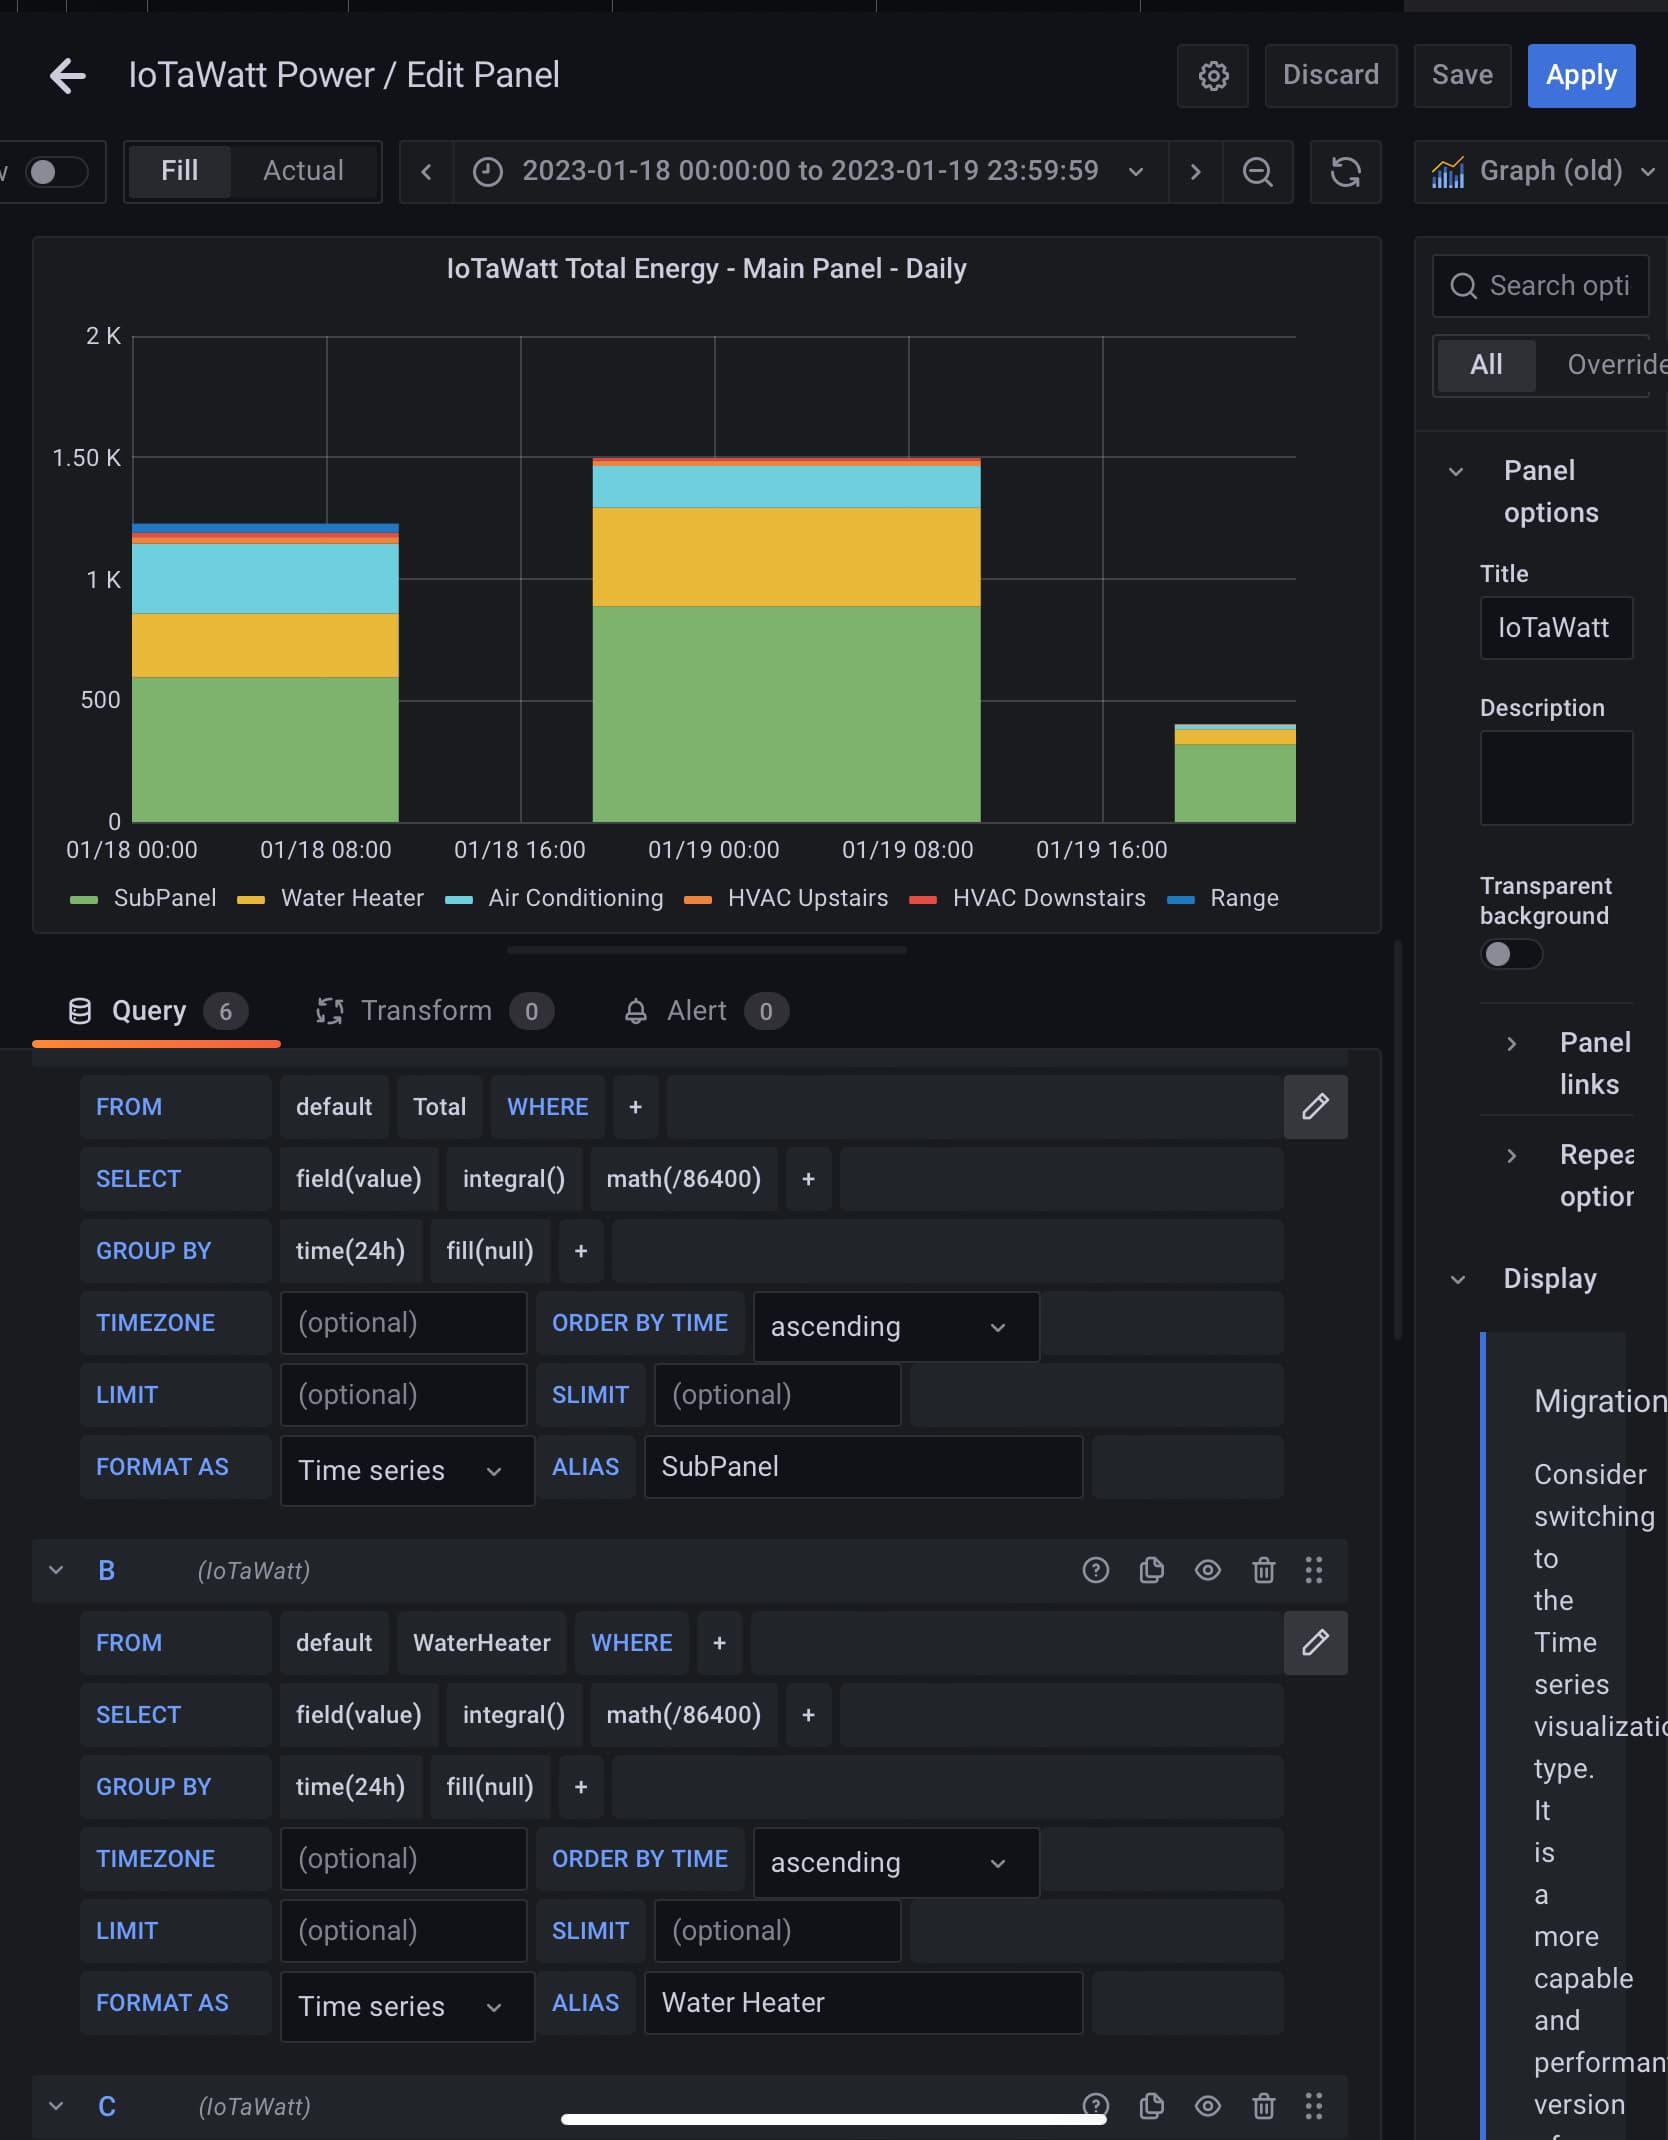
With InfluxdB as a backend however, I think there is an integral function which you can use for this purpose:

For comparison, with Prometheus, the query looks like this:

avg_over_time(power{job="hubitat", device_label="garage"}[$__range])*$__range_s/3600

Here is an exampleโ€ฆ

Thanks, I've configured my KwH query like your example, but I'm not certain it's working correctly, does this look right to you?

1 Like

I typically use that query with a stacked bar chart when looking at historical Energy usage.

For example

1 Like

This topic was automatically closed 365 days after the last reply. New replies are no longer allowed.