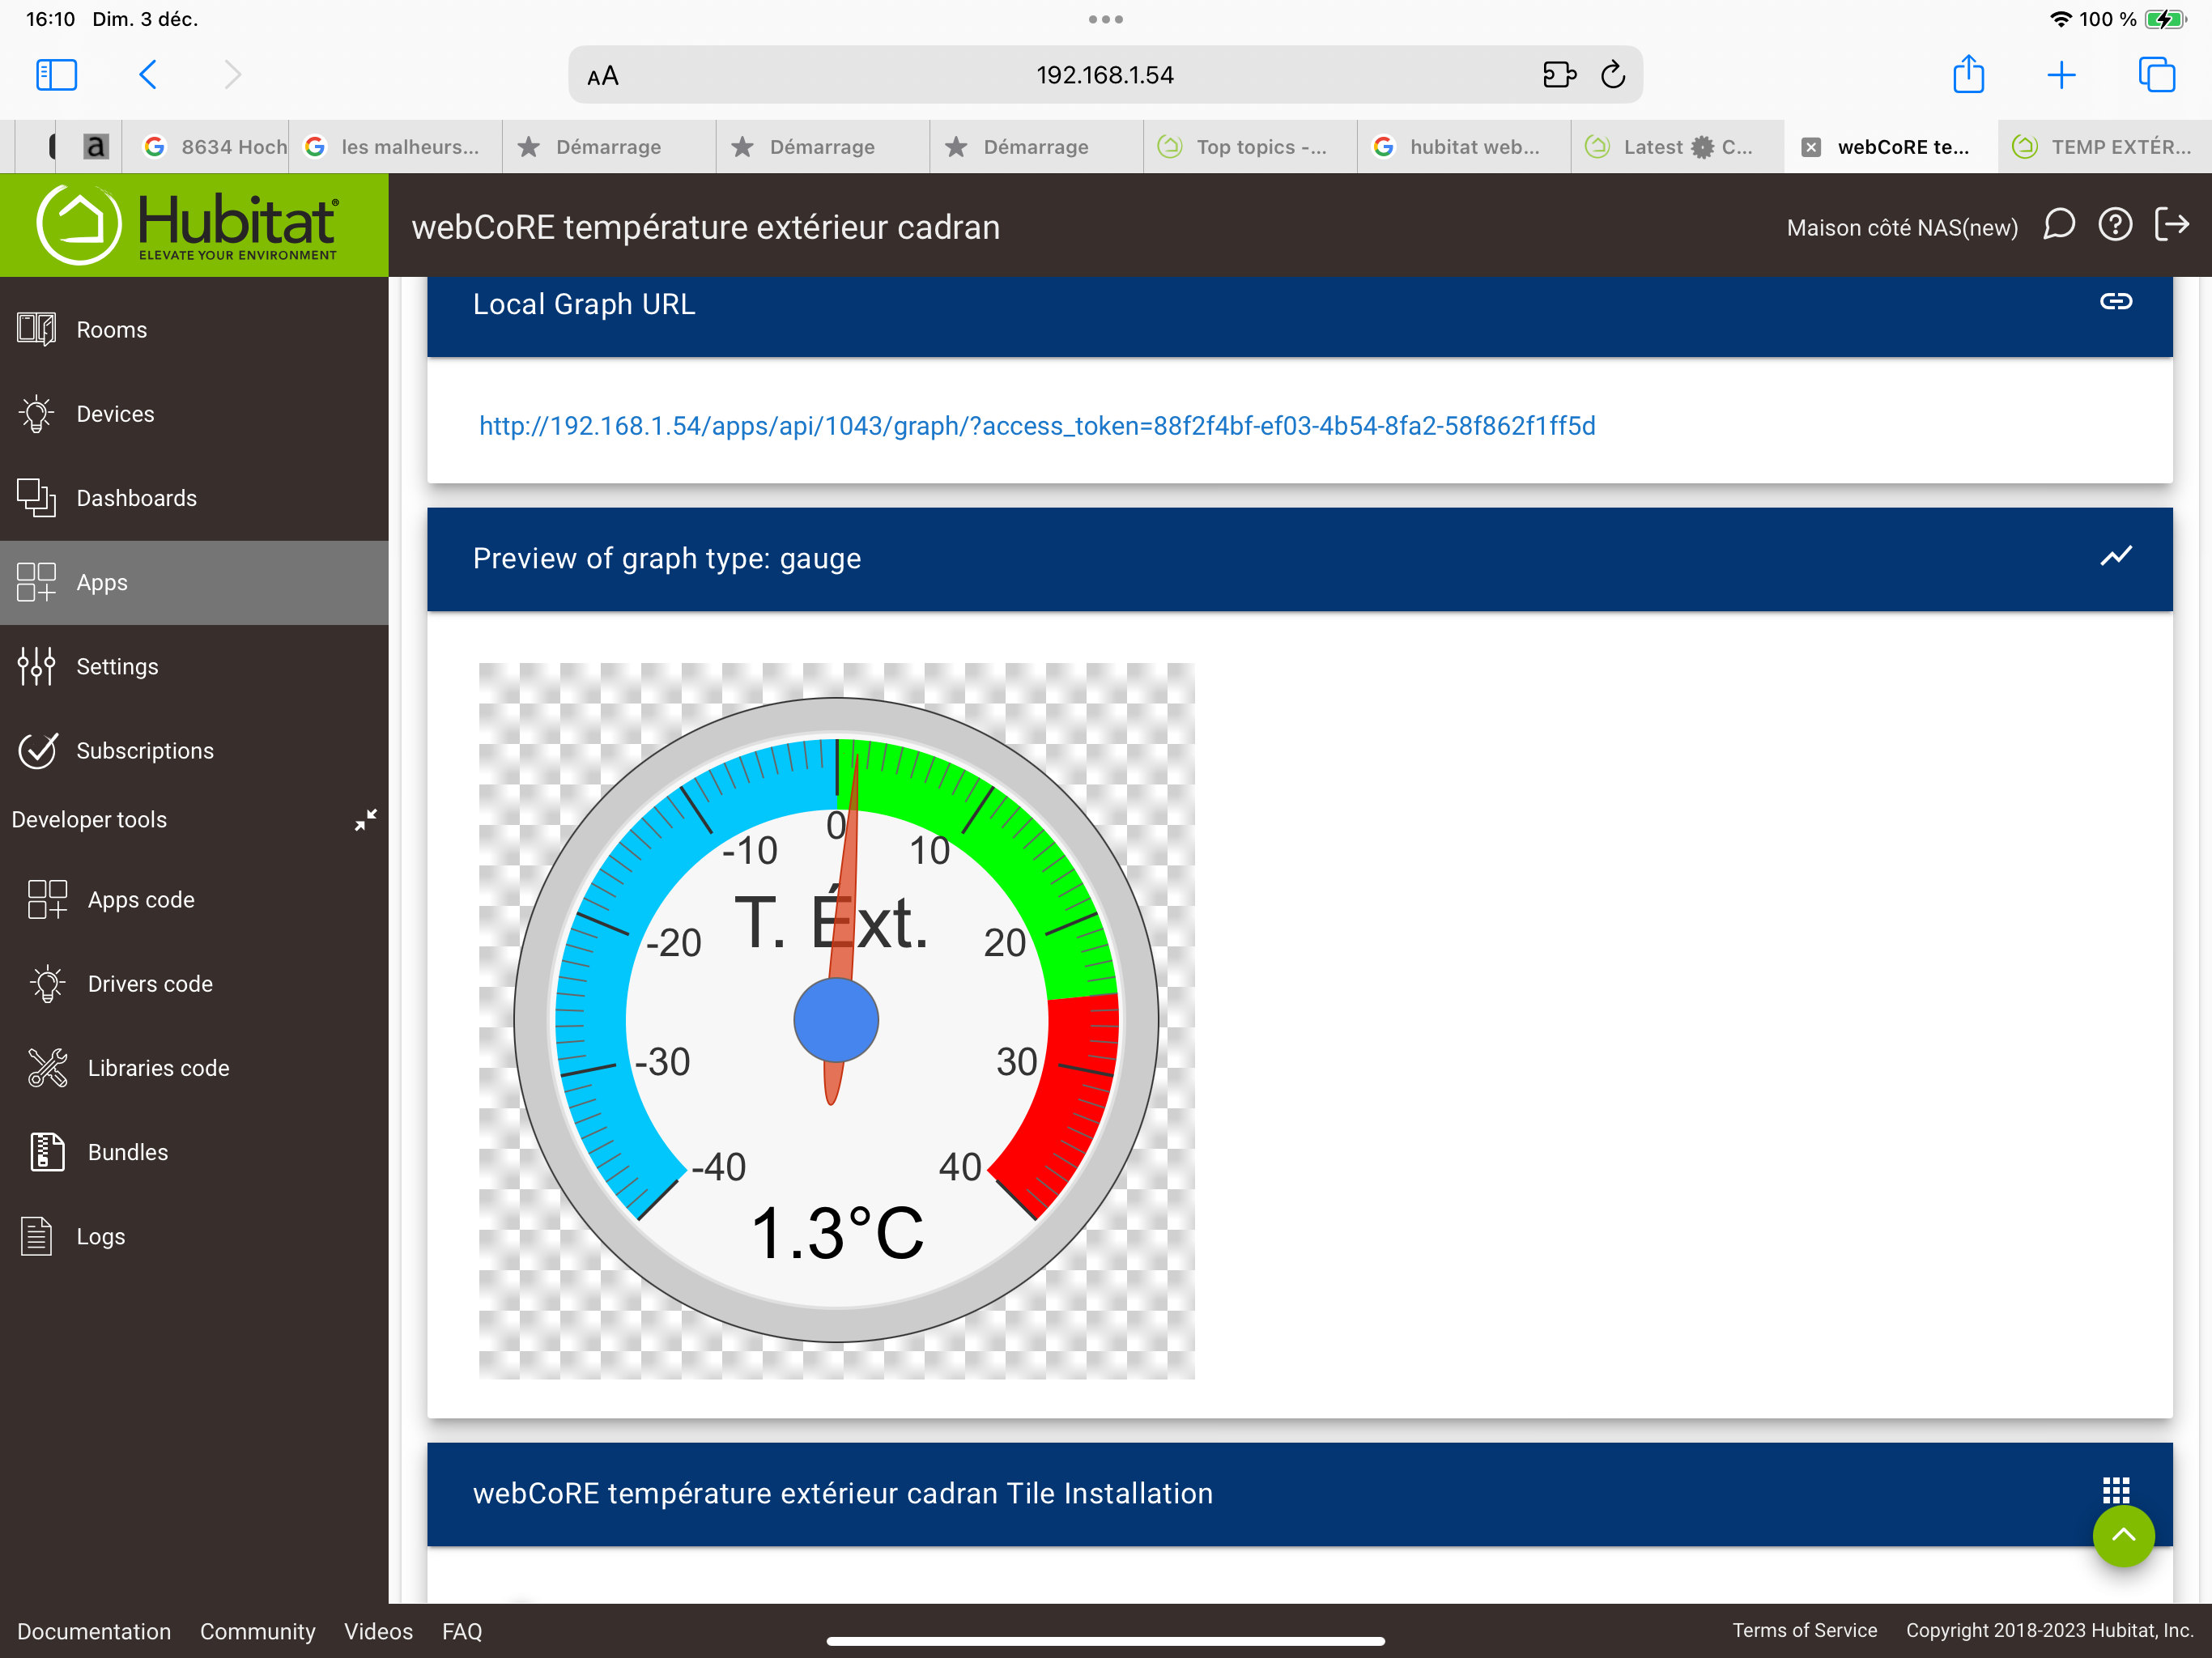
hello, the gauge graph displays the negative temperature correctly the first time. then when the temperature is updated it becomes positive. the minus sign disappears and the needle indicates a positive temperature. but the real temperature is always negative on the device.


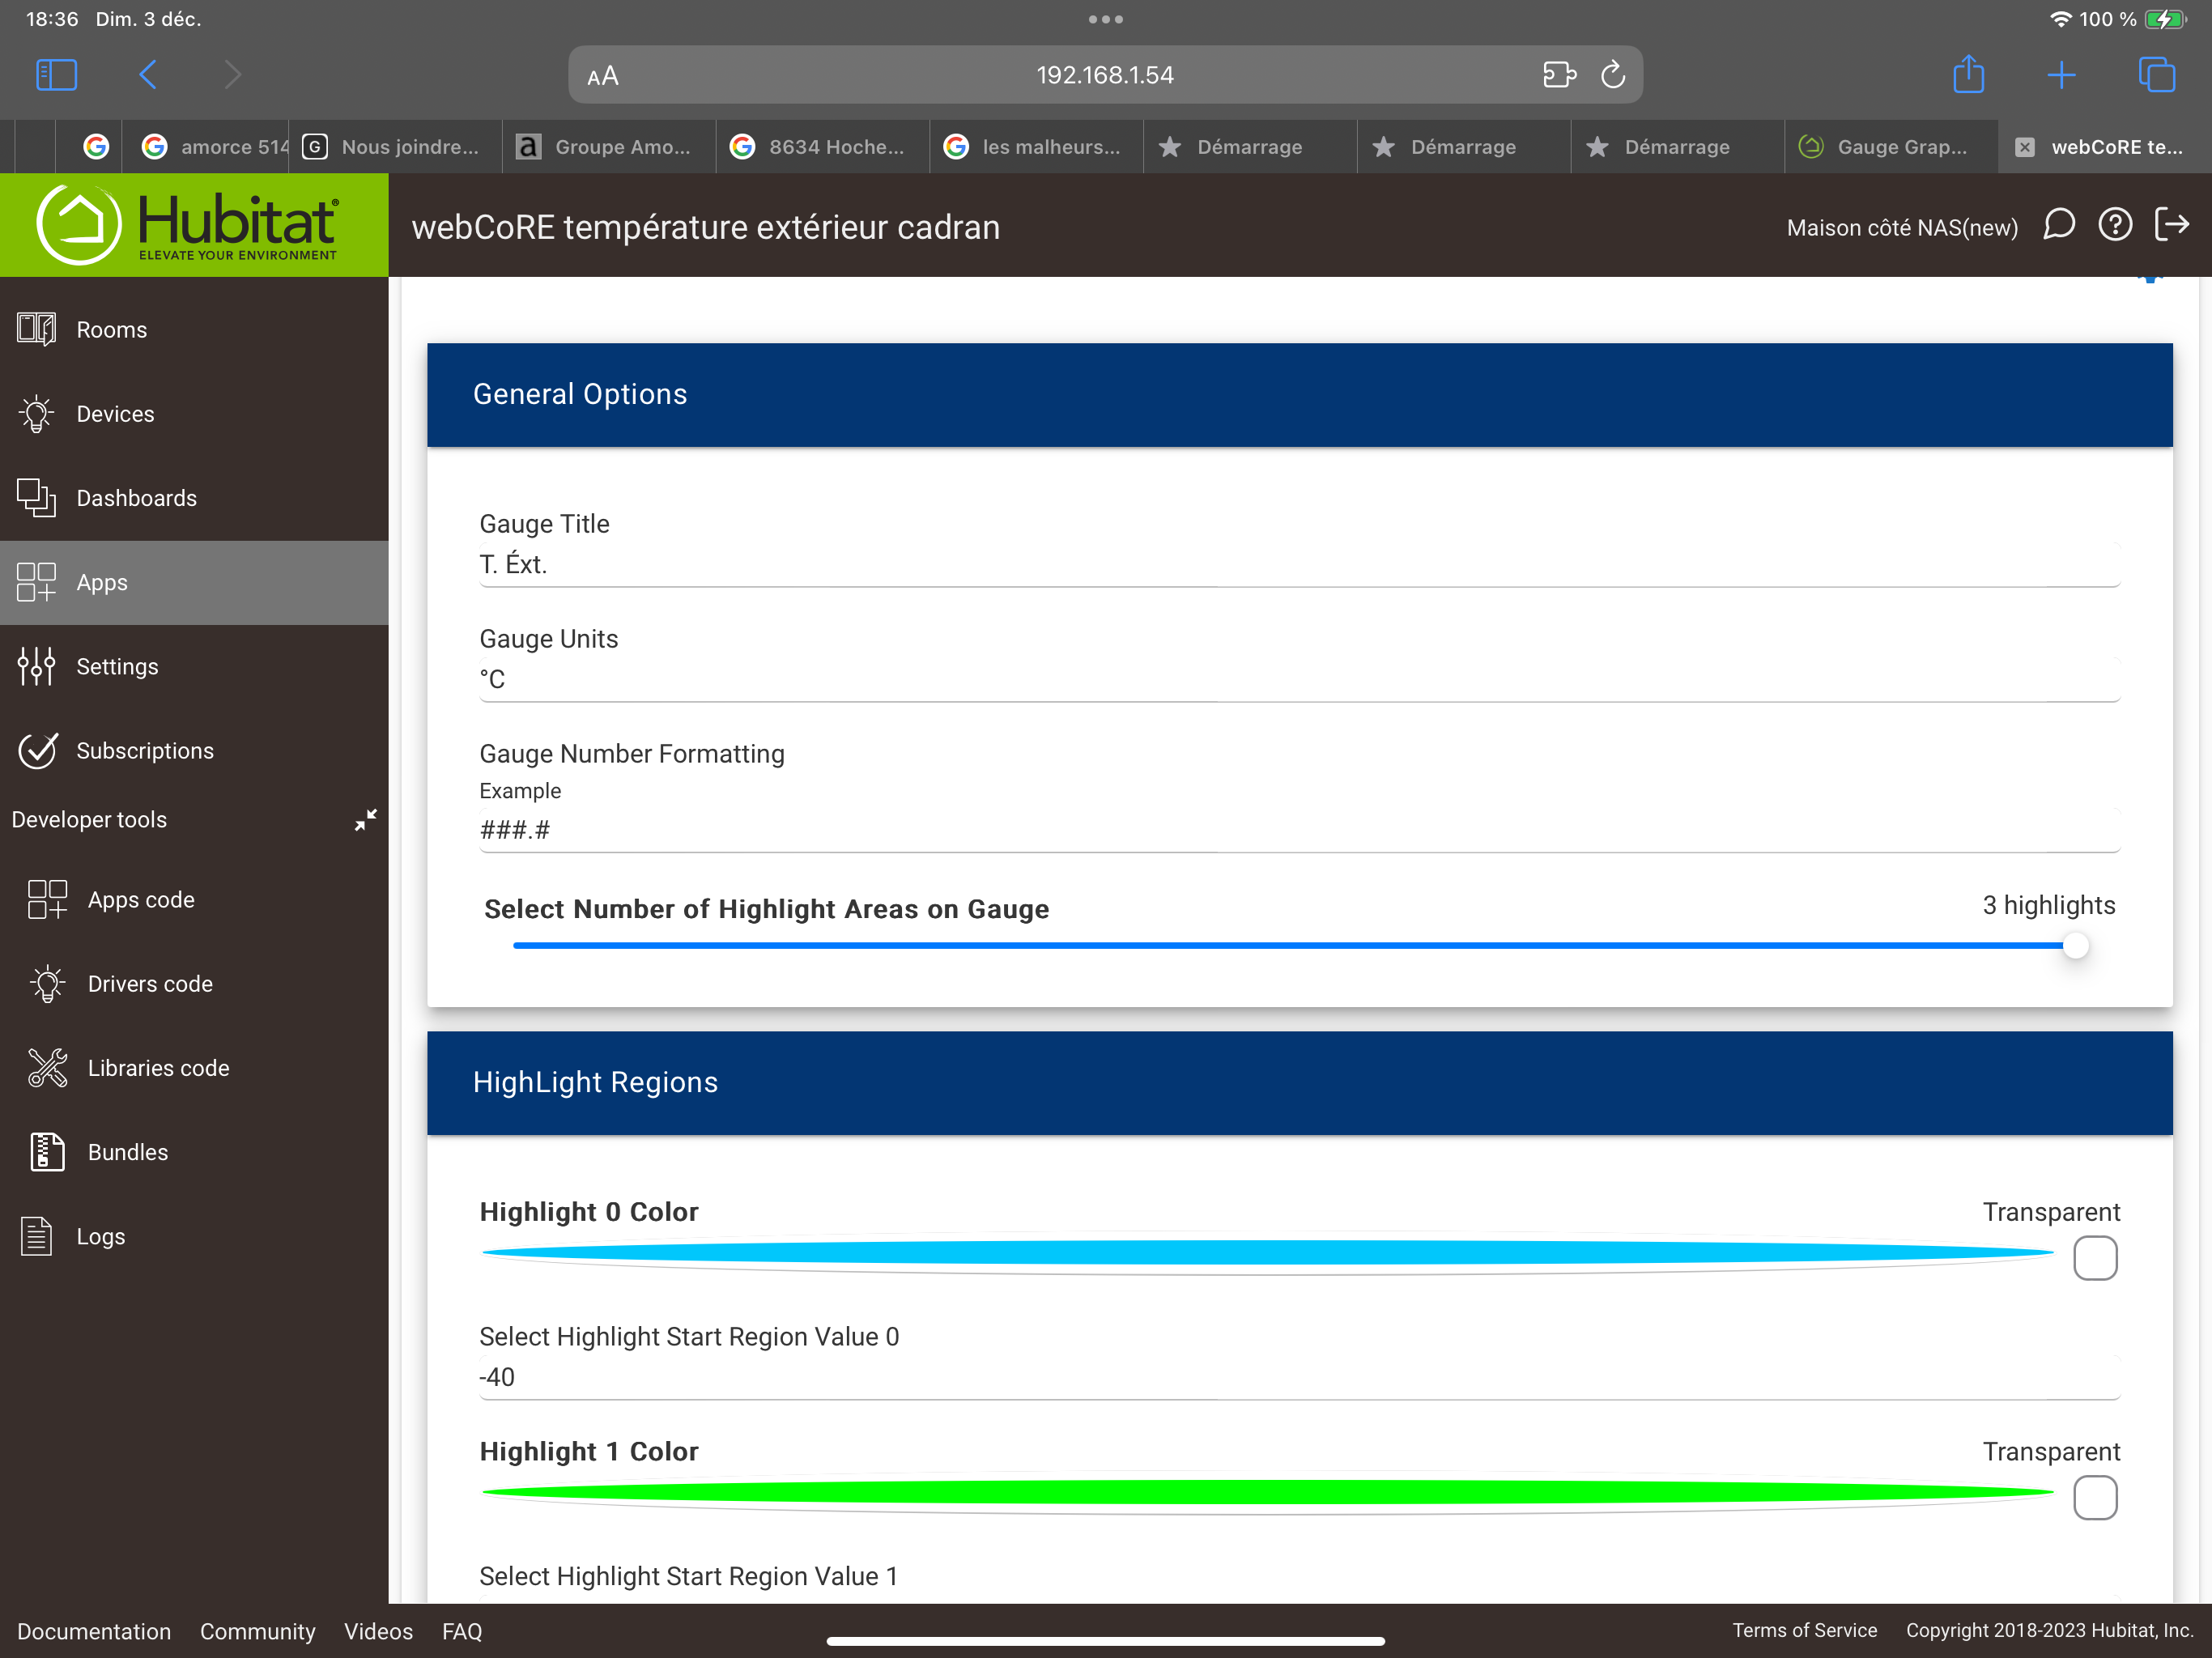
It would be good to show the settings for the gauge, including the minvalue and maxvalue settings
Hello
I updated my post with the parameters.
If you have a user install, please hpm repair on webcore to get the update.
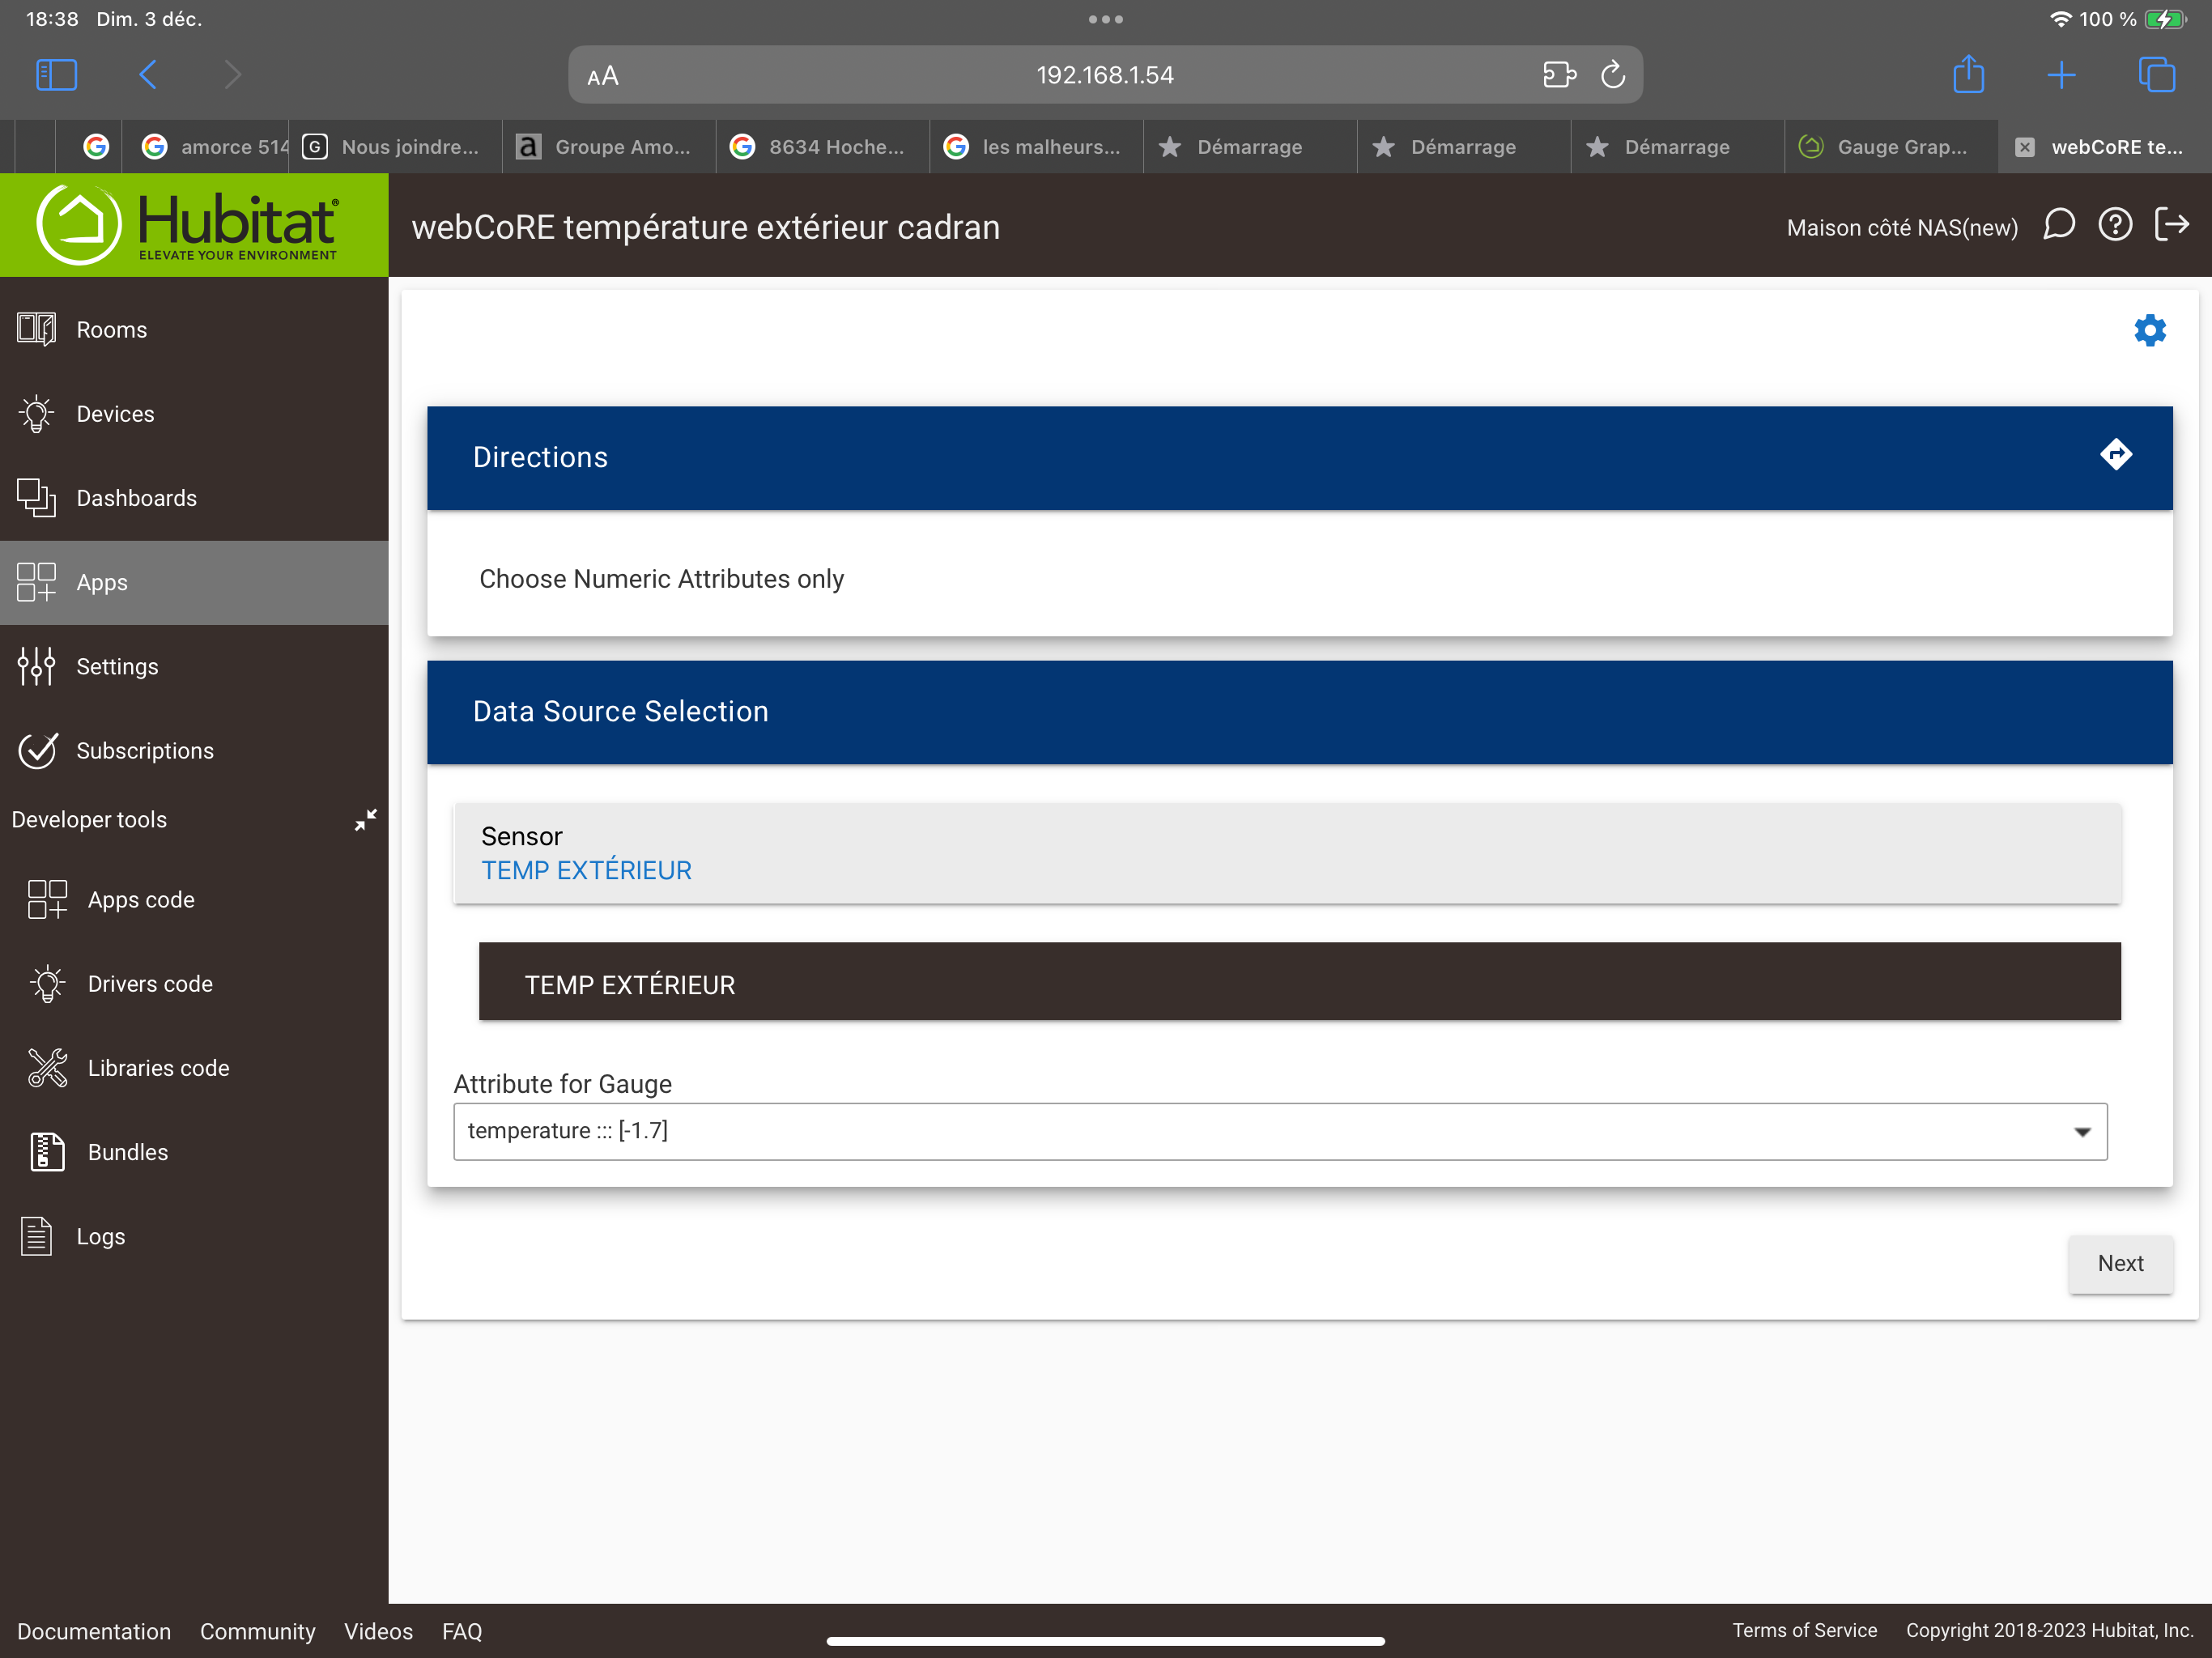
I did find a problem on the negative values.
1 Like
I used hubitat's build-in app to install webcore. Do I have to wait for an update from hubitat?
yes, it would need HE to ship the update.

