Thought it might be a good idea to have a Free Text Note Field On the Device Page for things like: Battery last changed on 00/00/00 etc.
4 Likes
Certainly not a bad idea. In the meantime, what I've stated doing is writing the date I installed the batteries on the battery itself when I inset it into the device. (Aeon Multi 6 is the worst offender: two only last a few months. I've had Iris v2 motion sensors go over a year, and probably longer with the ones I have yet to change and haven't looked to see.)
1 Like
8 Likes
I was just about to ask for the same thing - and found this post. +1 on this request.
Ditto,
note field would also allow for tracking behavioral history of suspect devices and as mentioned battery install date.
But this is all MANUAL tracking for something that should be highly automated in this day and age.
Battery Mgmt is likely one of everyone's biggest challenges. I had a device down for 3 days because I didn't act quite as fast as I thought I needed to after my 30% warning threshold was met/notified.
How about:
battery decline progress graphs,
battery decline predictive graphs,
or something along the line of what security systems offer ...an option to get 'missing device notifications' such as: " device xyz has not report in xx hours (or days, or weeks), or device xyz is not showing up in the daily poll"
ALL or some combination would be helpful in managing ever growing configurations so dependent on batteries.
+1 on the free text field
I also love the idea of a battery graph, however I've been experimenting with logging battery levels on ST using the Simple Data Logger app and as it would happen, some devices report battery levels all over the place. One would expect the battery to follow a downward curve, yet I've seen battery voltage both rise and fall (probably due to the large temperature differences we have out here in the southern Nevada desert). In short, it would appear that battery graphing needs to some smart filtering of the data.
I am seeing this as well. Wouldn't it be cool to see a 52 week graph of week average battery level plotted against week average temperature right on the device's config page.
Realizing this thread might belong somewhere else
That might be doable with some SQL wrangling. I'm currently researching if the ST Simple Event Logger app can be ported (or perhaps somebody's already done it). I've been using google sheets and it's graphing so far for datastorage but considering moving to influxdb so I can use Grafana.
I was thinking of applying some sort of logic to the logged data, such as:
IF current battery level > last measured level THEN currrent battery level = last measured level
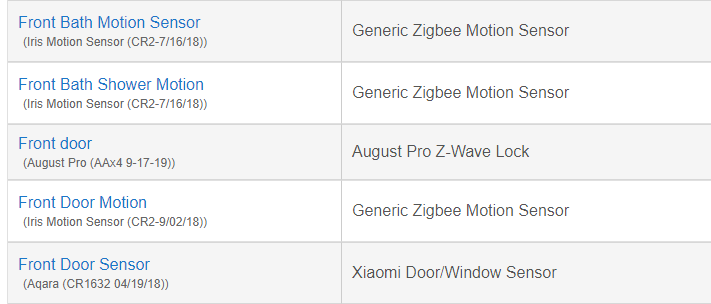
However that won't work if the battery voltage drops to zero and bounces back again. I tried logging all my battery devices and as you can see the pink graph is a good example of that:
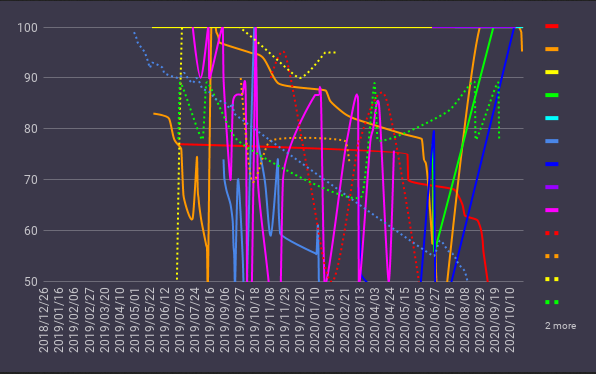
If I applied the above logic, it would flatline almost immediately. I think there are some averaging functions you can apply but I haven't done much with those yet. Any suggestions would be welcome.

