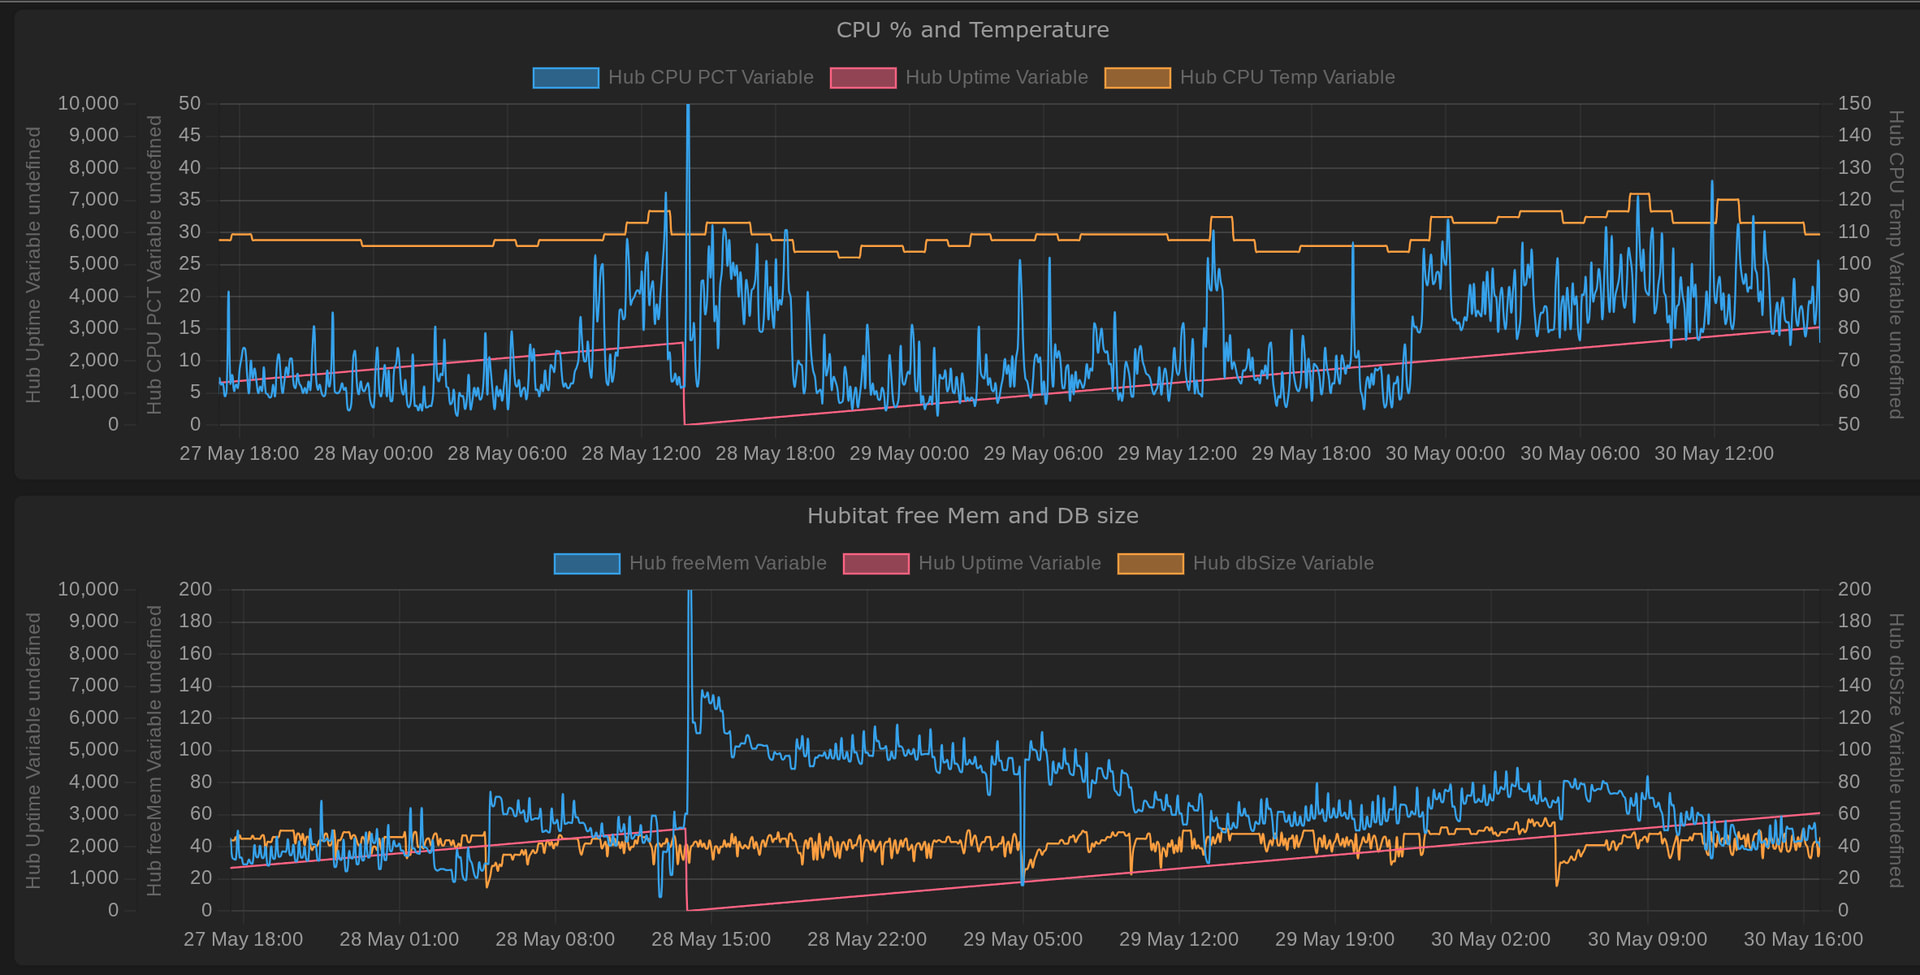
Now that we have been on version 2.5.0 for a few weeks, I had been hoping to see improvement in memory usage. I have been seeing something different on my C8. Just prior to 2.5.0, I had been reducing the history size of my devices and apps. This yielded not only a smaller database, but also reduced CPU utilization.
SInce the installation of 2.5.0, the interaction of Free Memory and Database size has changed. Prior to the installation, these two values appeared to track in opposite directions with the total of the two values remaining fairly constant.
Since 2.5.0, this interaction has changed dramatically. The values no longer track with each other. Many times both track down. These two variables react quite differently to the Nightly Database Cleanup routine and to a Reboot with Database Rebuild.
First let me say that I have done no RM programming during this time and have done one update to a Community App. I have wanted to have a stable system to see how the Free Memory cleanup affects the system in this new version.
The Watchtower charts below show nearly the last 3 days with several Cleanup routines running about 4am and a Reboot with Rebuild indicated by the Uptime hub variable (the red line in both charts} returning to 0.
Note that the CPU Utilization (Blue Line on top chart) flips between the typical 5-15% range that held prior to the 2.5.0 installation and a higher range sometimes with no correlation to the activity of the Free Memory variable. The CPU Temperature (in F) also increased when the CPU utilization I created.
The Low Memory system alerts continue with the same settings, even though the performance is not affected by the low free memory. Are we going to see new alert settings?
@gopher.ny@bobbyD this post may be on a weekend, please respond when you return to work next week.
Just coming here to say that I have the same problem. This was mentioned on two other threads already. And while the timing looks to be 2.5.XX, if actually started for me on 2.4.156. Prior to that, I never had to reboot due to low memory and my memory stayed above 400 MB.
(C7 hardware BTW)
After updating to 2.4.156, my memory hovered around 330, even after a reboot with rebuild.
After jumping to 2.5.XX, the memory still averaged around 330 and I was getting notices that my free mem dropped below 250 frequently (up to two times per day).
I could not go back to 2.4.155 as that is more than 3 updates ago. But, putting it back on 2.4.156 solves the low memory alert issues. However, it rapidly drops back to 330.
Unfortunately, I did not start running watchtower until after I updated to 2.4.156. So, I do not have full graphs
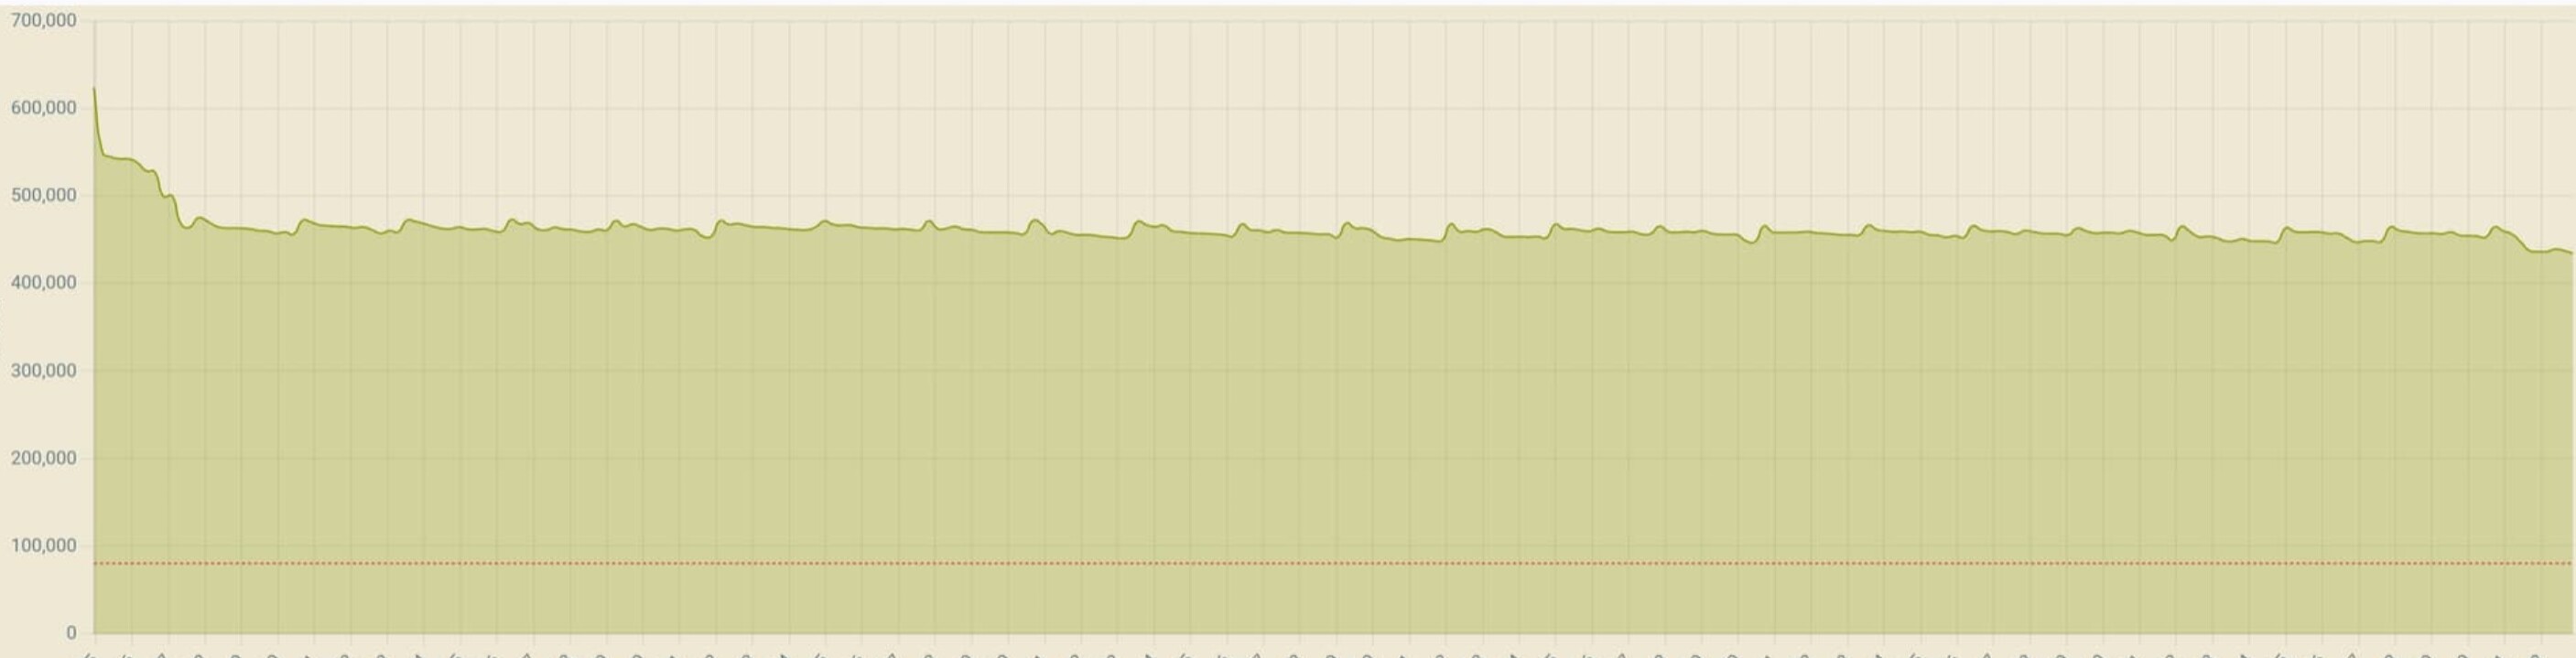
Here is the graph since 2.4.156 (Red vertical lines are reboots with rebuild, yellowish vertical lines are firmware updates or reverts to prior versions)
Prior to the 2.4.155 update, I used the zigbee map app for graphs. I have an older one I saved from a post. This is what my free memory used to look like and it would usually stay that way until a firmware update
C5 user here and you have probably seen my "diary" in another thread. I'm not running watch tower so I don't have any pretty graphs to share. The 2.5 series firmware has definitely changed something. I just looked and I'm currently setting at 119K free. I'm on day 8 since last reboot. I saw 120s earlier today and suspect I will again after the next cleanup. Since it was brought up here I looked and CPU utilization is at 13.5%. I have a fairly heavy outside light rule running so that is probably why it's elevated. I have never seen my hub with free mem levels this low until the 2.5 series. The house seems to be functioning normally with no noticable slowdowns. I'm waiting to see if I run out of memory or if it stabilizes. On the previous firmware it would stabilize at around 190K. I tagged support in another thread hoping for a response but never received one. They are probably busy with other things. I would just like to know why the memory usage changed so dramatically and is it expected.
I discovered my memory floor. As I executed the good night routine several lights did not turn off and were unresponsive from their respective device pages and dashboards. These were all zwave lights. I looked and my free mem had dropped to 112K. It didn't cleanup back to the 120s as I expected. I have since set the reboot rule to fire in the wee hours if free mem is below 125K. Since others are seeing memory issues too I'm going to hope that the devs take notice and maybe fix it. If not, I'm rarely up at this time so won't even notice anything.
There have been a number of threads about memory leaks in the past few weeks. I have an 8 Pro so the headroom definitely helps a lot. But there is something “up” and honestly I think it started with the addition of Bluetooth. I wish we could disable Bluetooth if we don’t need it. Caveat: this is utter conjecture and might be entirely wrong. But, I have a strong feeling about it because I could run a month or more without ever thinking about rebooting - usually because I wanted the features in a new update. Now, I nervously keep an eye on free memory.
My experience has been a little different. I didn't see this behavior with the 2.4.4 firmware, which introduced Bluetooth. The memory on my C5 used to settle at around 190K and stay there unless I made a lot of changes to the hub. Then I would see a permanent decrease in free memory, but usually still not enough to require a reboot. For me, this memory issue started with the release of the 2.5 series. I even rolled back to 2.4.4.156 for a week and the issue disappeared.
When I rolled back to .156, I stopped getting low memory alerts (from occaisional spikes). However, the free memory stayed significantly lower than pre ".156" (may have been pre ".155" as I might have skipped to 156 from 151 after looking at my backups)
Maybe another point to add here (now that I have had time to look a bit deeper)
When I get the alerts, I open up my watch tower graphs to look and see when the alert came. In almost all instances, I see it spike into the mid 200's (MB) and then return to 330.
Looking at my alert rule, it just dawned on me that I had set the alert to go off a for low OS memory AND low JFMFree. Turns out, the alerts were always coming in for JVM Free and not OS. I had it set for 50 MB - seems like I had read that was a good number somewhere.
In any case, on 2.5.XX, I see intermittent drops as low as 18 MB. So, this is what is causing my alerts I think. I have updated my alert message to point out which memory was low. So will see what is the trigger moving forward.
I wonder what is causing this spike, and even if it is worth worrying about at this point. I had read another post that said that JVM Free might be a useless indicator. I left the 50MB threshold in my rule though - and I never got ANY messages for this prior to 2.5.XX - 2.4.4.156 fixes that issue - just doesn't bring my overall free memory back up to where it was before.
My C8 has continued to operate well, with CPU utilization less than 25%. It would be interesting to see if the hub would run as well with skipping one of the nightly cleanup routines. If the memory leak is fixed then we don't need to do the cleanup. It would be interesting to see if the hub can run without any cleanup routines.
I have already changed my weekly reboot with a database rebuild from a weekly frequency to two weeks. Just to see what happens. @bobbyD@gopher.ny
I volunteer to have my hub do the nightly cleanup every other night. FIrst step toward letting the hub run continuously.
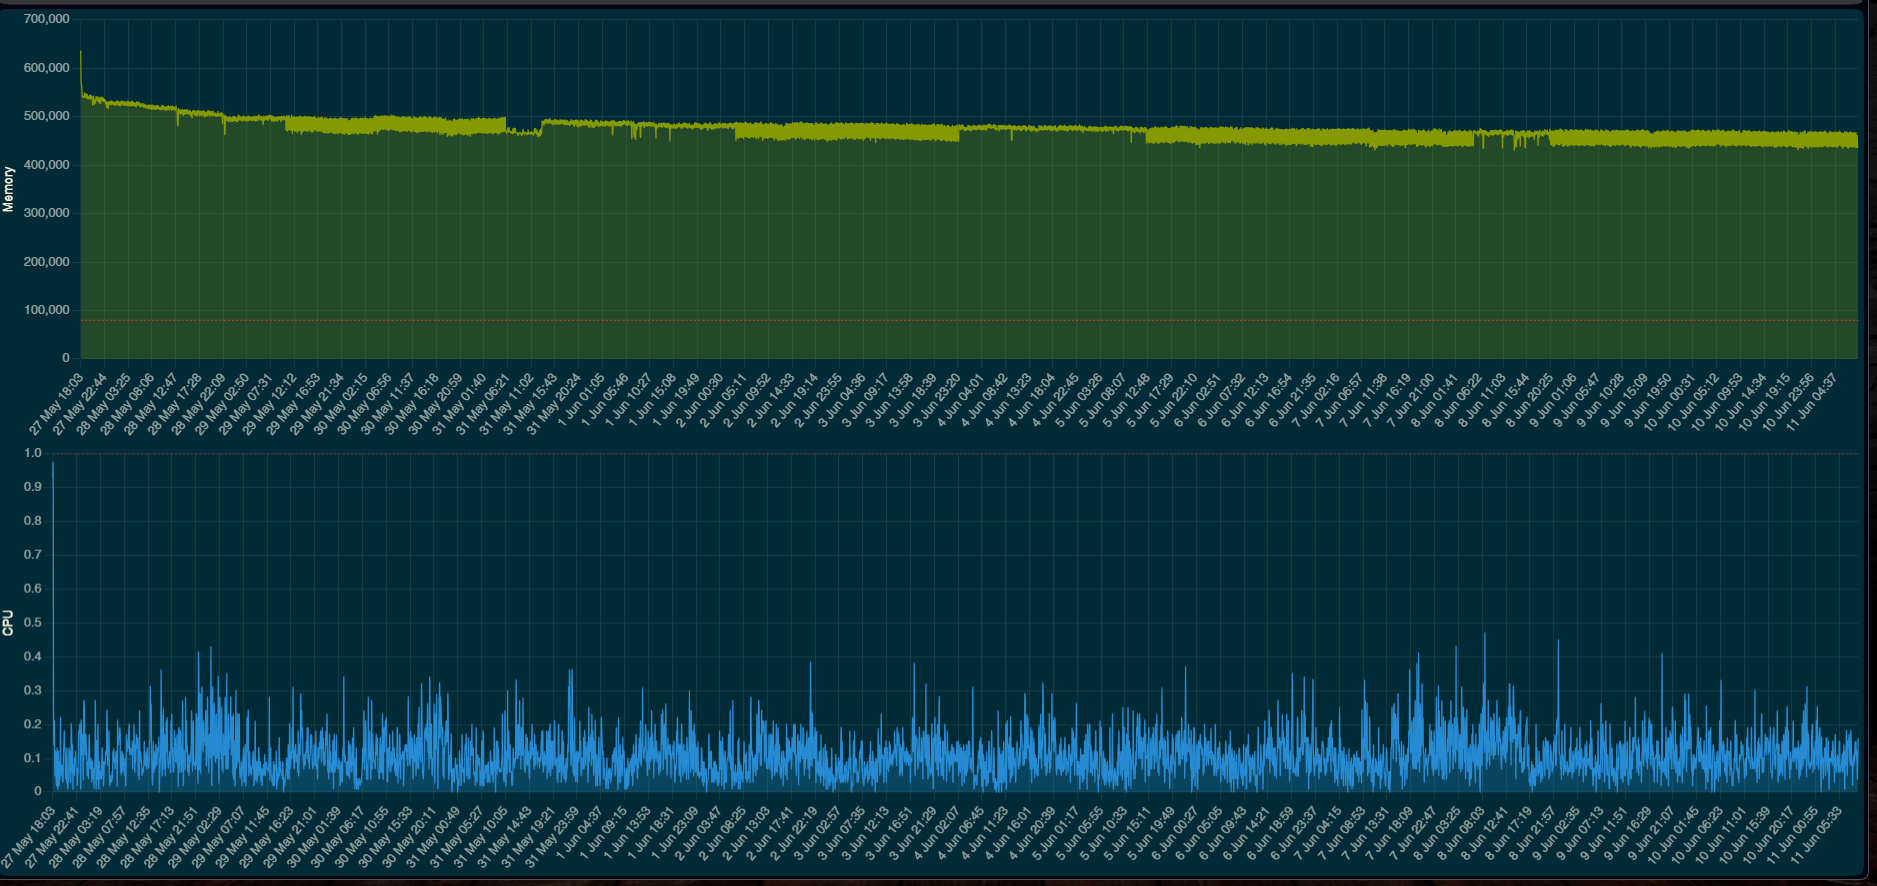
As can be seen in this screen shot, the installation of 2.5.0.153 was on 6/4. Since then, the memory has been running fairly consistently.