so you are not able to get Flume data into influx in any way? or do you use any other alternatives?
I don't use influx. What is the issue?
this past chat we had few months back - values are not usable for influx DB.
I simply use the Flume native app, it has a huge amount of data with dashboard etc.
I wish I could port all this data into the Grafana I'm using for all my devices.
Ah, I forgot about that discussion.
But still, I do not understand the issue. Does it mean that no custom attributes can be supported by whatever influxdb integration you are using, or is it that the format of my custom attributes are wrong?
I'd be happy to try to help, but I don't use the influxdb integration and don't understand the issue.
As an example
the flowStatus : stopped / running realtime value is not logged in influx properly hence there is no way to visualize it in Grafana to get a chart of "running/stopped" view overtime. the water category in Grafana does not provide any values for the Flume device.
Why not? That's what I don't understand, as I'm not an influx user and I don't know what is logging the events and data into that environment.
What integration or setup are you using to get the events from Hubitat logged in to influx? I need to see whether it's an issue that custom attributes aren't supported at all OR if there's an issue with the format of attributes that I'm using.
Here are samples for other devices from the HE influx DB logs - maybe this can help you better understand where the issue is: AMinfoQueued event: valve,deviceName=House\ Main\ Water\ Valvae,deviceId=874,hubName=Main,unit=valve value="open",valueBinary=1i 1690038887051000000
AMinfoQueued event: valve,deviceName=Rachio\ -\ Rachio-BD6236,deviceId=2,hubName=Main,unit=valve value="close",valueBinary=0i 1690038887051000000
AMinfoQueued event: ultravioletIndex,deviceName=Aeotec\ Back\ Yard\ Sensor\ on\ Remote,deviceId=915,hubName=Main value=0 1690038887051000000
I do not see any lines of reported values going into the DB from the Flume device.
I think this is where the gap is.
BTW the Flume device is already added in the influx DB as Water sensor.
I truly appreciate your attempt to help with this.
Where is the code that is producing those logs?
EDIT: I think I found it.
Look for this option in the app configuration under Devices to Monitor: Advanced attribute seletion?
It looks like that could be used to specify custom attributes.
I'm only skimming the code, but it does look like it would be used instead of the built-in devices, not in addition to them. Maybe @ogiewon or @dennypage could confirm and advise whether it could be made to support the union of those two types of inputs (built-in and advanced/custom)
Thank you for that, good finding, looking into it now and will report back, I did configure it already to report some data and waiting now for the DB to be populated with some data.
Will update soon.
1 Like
I'll send you a PM with a modified version of the InfluxDB Logger code to try.
No need for that anymore. The InfluxDB now supports multiple instances, so you can have one instance to manage devices using built-in attributes, and a separate instance to manage devices requiring custom attributes.
Multiple instances are also very useful for when you want different backlog settings or different event handling (such as keep alive) for various devices.
2 Likes
Just an update - Huge thank you for a great work and advise by @tomw - I now have stats getting into influxDB and I can now see them in Grafana too.
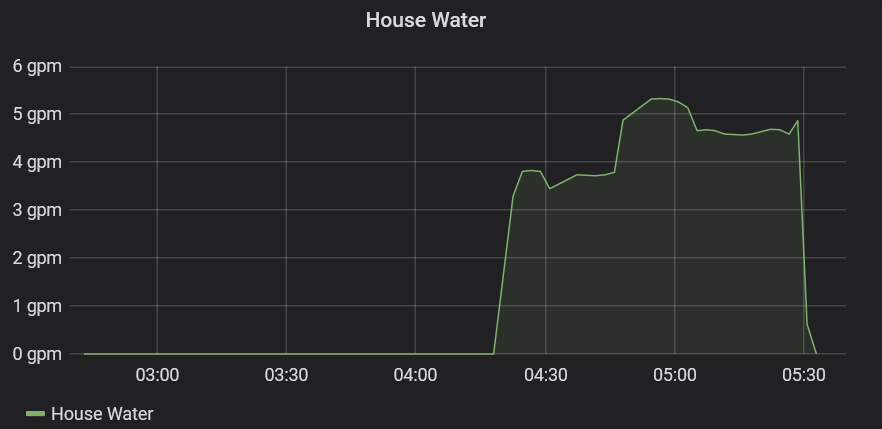
The solution which worked for me is to enable in the influx integration app the configuration under Devices to Monitor: Advanced attribute selection and then add the specific attributes I want to send to the infuxDB from the Flume device. that worked and I have now multiple data sets recorded in the DB and able to visualize them in Grafana charts.
4 Likes
Hi guys,
Just to close the loop on this one - after letting it soak some time, I discovered that when I switched the "advanced devices" toggle in the influx DB logger app. , only the Flume device attributes were reported to the DB but all other devices stopped reporting as I did not configure them one by one in the advanced view.
@tomw did another great work with providing modification to the influx DB logger app - It combines the "Advanced" device selection with the built-in one where you just select them by type (like Accelerometers, Alarms, etc). After applying this fix, all is back working as before and all devices are reporting in the DB while the advanced devices toggle in the app is enabled.
All you need to do is to replace the section in the influx DB logger app code with this updated one:
private Map<String,List> getDeviceAttrMap() {
    deviceAttrMap = [:]

    // add "Advanced" selections
    settings.allDevices.each { device ->
        deviceId = device.getId()
        deviceAttrMap[device] = settings["attrForDev${deviceId}"]
    }

    // add automatic (built-in) selections
    deviceTypeMap.each { name, entry ->
        deviceList = settings."${name}"
        if (deviceList) {
            deviceList.each { device ->
                deviceAttrMap[device] = entry.attributes
            }
        }
    }

    return deviceAttrMap
}
All credits goes to @tomw !!
2 Likes
I'm glad that modification worked for you @Esalomo, but it is likely better to take @dennypage's advice here and install two instances of the app in Hubitat.
That way you won't have to maintain a modified version of this method with future app code updates for the InfluxDB integration.
1 Like
thank you so much for this! I created a new app and modified the second app to send Flume data. I will monitor a few days and see how it goes.
Thank you again!
1 Like
I have a strange problem. When i setup the bucket in influx and the app in Hubitat just for flume. It worked fine yesterday but today i am not seeing any data flowing into influxdb2.
I am seeing the following logs in the Hubitat;
[app:436]2023-07-26 11:23:42.085warnBacklog of 1805 events
[app:436]2023-07-26 11:23:42.081[warn]Post of 50 events failed - elapsed time 0.164 seconds - Status: 422, Error: Unprocessable Entity, Headers: [X-Influxdb-Build:OSS, X-Platform-Error-Code:unprocessable entity, X-Influxdb-Version:v2.7.1, Content-Length:225, Date:Wed, 26 Jul 2023 15:23:37 GMT, Content-Type:application/json; charset=utf-8], Data: null
I am not sure if the issue on the influx side or hubitat. Any idea what this might be?
422 is an Invalid Data response.
is it about the data getting ingested into influx? do you know what would be best way to debug this?
I deleted the second instance of the influx logger app and added back again with new bucket, and token etc but still getting the same error!
@tomw do you have any idea! how to trooubleshoot further?
I think I saw a discussion a few months ago where the integration was sending a string and Influx was expecting a numeric or vice-versa. I'll see if I can find that again.
1 Like

