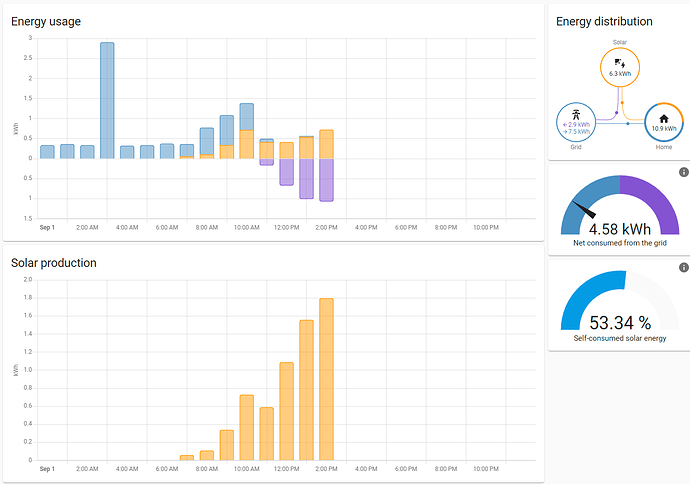
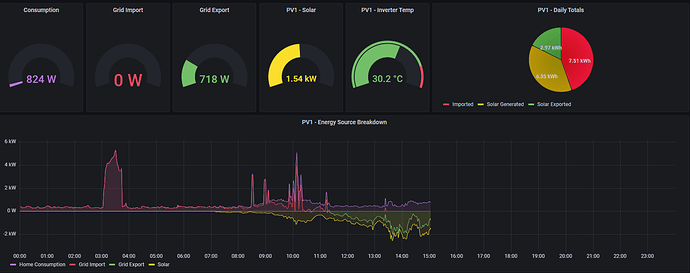
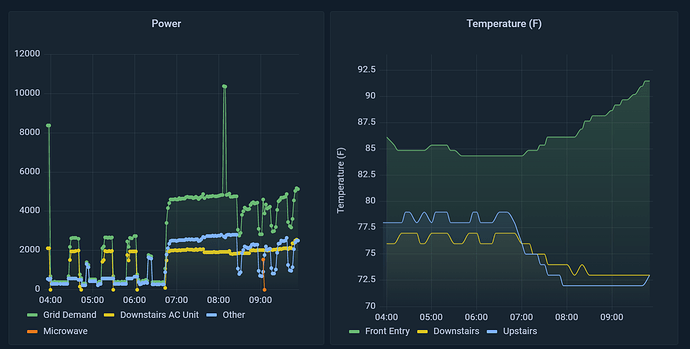
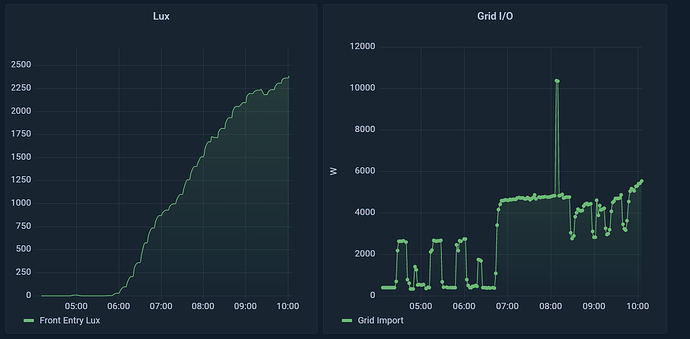
With Energy costs being such a major topic currently, I've been spending a lot of effort trying to represent my energy usage in a clear dashboard.
I'm not a great fan of the presentation style of Hubitat dashboards and so have tried Home Assistant and Grafana.
I have tried using the Energy dashboard in HA, as well as custom dashboards but didn't find that they addressed all of my requirements:
My preferred option to date is to export data from HE to InfluxDB (using InfluxDB logger) and then used Grafana to display the information. I thought it would be helpful for others if we all share different formats so people can use them as inspiration and give feedback and advice:
Note:
I'm about to have a second Solar Array installed and so this is still 'work in progress' with more information to add. Also, please note that today isn't a great solar generation day!
Please share your own examples and we can all build and enhance our dashboards as a result. 


