I need to buy some smart plugs, to identify where is all my electric bill going. So could you help me with a plug that can connect to my hubitat and how to keep a record of consumption?
For example connect it for a month or so to the fridge and be able to see how it worked during that month and try to track better where is most of the energy going?
Is it possible or am i just asking too much?
I am ordering the AEOTEC gen 5 energy monitor but that will keep track of the whole house. I need some other independent devices .
I use an IoTaWatt device, which allows for monitoring an entire electrical panel. This provides much better data than smart plugs or the AEOTEC HEM, IMHO. While it may seem a little pricey at first, it does such a better job at collecting and sharing home energy use data as it is specifically designed for doing so.
I also wrote an integration for Hubitat, which I use to know when laundry cycles are done. Can also use Hubitat to notify me if there is a problem with the IoTaWatt's connection to the home WiFi system, or whatever else one might dream up!
so you think it s better getting a wifi device rather than zigbee or zwave? I want to go on one of those last two since i want to have it available the data on the dashboard
Accurate Power Monitoring requires a lot of data to be collected. Z-Wave and Zigbee mesh networks aren't really designed to handle the flood of data necessary to calculate accurate energy usage over long periods of time. You'll see lots of folks recommending that users actually disable power monitoring on their Z-Wave devices as it can bog down the network. Also, Hubitat does not provide a good way of storing historical data, nor presenting such data in user a friendly graphical manner. There have been some community developed enhancements in this area, but I prefer to use a purpose-built device like IoTaWatt as it was designed specifically for this task, and it works extremely well. It is also designed to automatically archive data to InfluxDB or EmonCMS. I use InfluxDB + Grafana to display historical data. Works great!
No recommendation on zigbee/z-wave vs wifi. That has to be your choice based and I am prejudice to wifi being equivalent to the others.
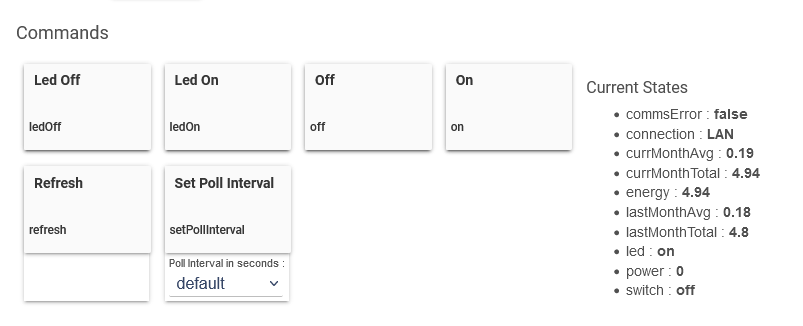
However; I have integrated the Kasa series of devices; including the KP115 EM plug. The plug in US is 110V only and supports up to 15 amps. Below is a capture of the screen on my device.
InfluxDB and Grafana are both services that must be run on another always on system, like a Raspberry Pi, or a Linux / MS Windows /MAC OS machine. I run them both on a Windows 10 machine that I use as my 'Home Server' box. Grafana provides a web interface to display the InfluxDB historical data.
The beauty of the IoTaWatt device is that is stores data locally on it SD card for over a year. Data can be graphed simply by point a web browser at the IoTaWatt device. Thus, it is a complete whole home energy monitoring solution all on its own. Or, one can integrate it with InfluxDB, Hubitat, and/or Home Assistant.
I do this with several devices. I use ZEN16s or Aeotec6 smart plugs.
You don't need to power monitor the device you want energy consumption. Both of these devices show the energy usage of your device. For me it's a easy to know how much it cost to run a device because our energy cost are a constant rate. I know some places you have to use different rates during certain times or seasons.
Below is a dashboard from my crawlspace dehumidifier. Its plugged in to a Aeotec6 smart plug. The two circled areas are the total energy usage for the month and the cost. The graphs are showing humidity levels and temps in different areas of the crawlspace and the power is graph is showing me how often the unit is turning on and off during the day. I do this for several devices in the house. This is just on example. I also have a whole house HEM installed. So it can be done.
I have read enough to know it's the right tool for the job, just haven't sussed out the minimal configuration/most flexible array of clamps. I have a concern that AFTER I have learned what I need to (in order to minimize big energy wastes)...that I might not bother with it much thereafter. Probably underestimating the value of broader long term power oversight here.
Yea, I can understand this concern. I will say that I have been able to continue to use my IoTaWatt devices to gain insight into the performance of my pair of heat pumps. It is really useful to know what 'normal' looks like, so it becomes obvious when 'abnormal' energy usage shows up in a chart. This has helped me identity excessive auxiliary heat strip usage, which could have gone undetected for quite some time. I was also able to quickly identify a partially-failed Nest thermostat. So, I find value in having the data constantly collected and easily presented in graphical form. YMMV, of course!
Are those "tile graphs" coming from a community App like Hubigraphs ?
(he asks, freshly reminded that it is frustrating that this USEFUL capability isn't a supported HE resident app for recent data even if not for longer term historical data series).
Yeah it's a shame the developer left, as it is a very useful tool, that does need some tweaks. I was hoping someone would take over but no one has jumped up to take it on. It's definitely an app I would make a donation to.
But it is worth noting the graphing tiles you are showing don't look to have reams of data driving them (falling within the HE is not a database repository & analysis tool argument). Yet they show just enough of the recent trend to give one some indication of conditions.
That use might arguably suffice for a HUGE chunk of graphing desires. There is so much about HE that is "you can do it all here, no need to go to the cloud" on one hand; and then there's the ever present "other hand" that says..."oh, that doesn't belong on HE, go use this cloud app or another server".
This functionality should be onboard. If you tell me you can't handle more than X data elements for a particular sensor/tracking...fine, I'll live within that and expect future hardware "Cx" platforms to expand this limitation.
OK, DO NOT LET THIS DERAIL THIS THREAD. If you don't agree just leave it be. IF you agree, gimme a like
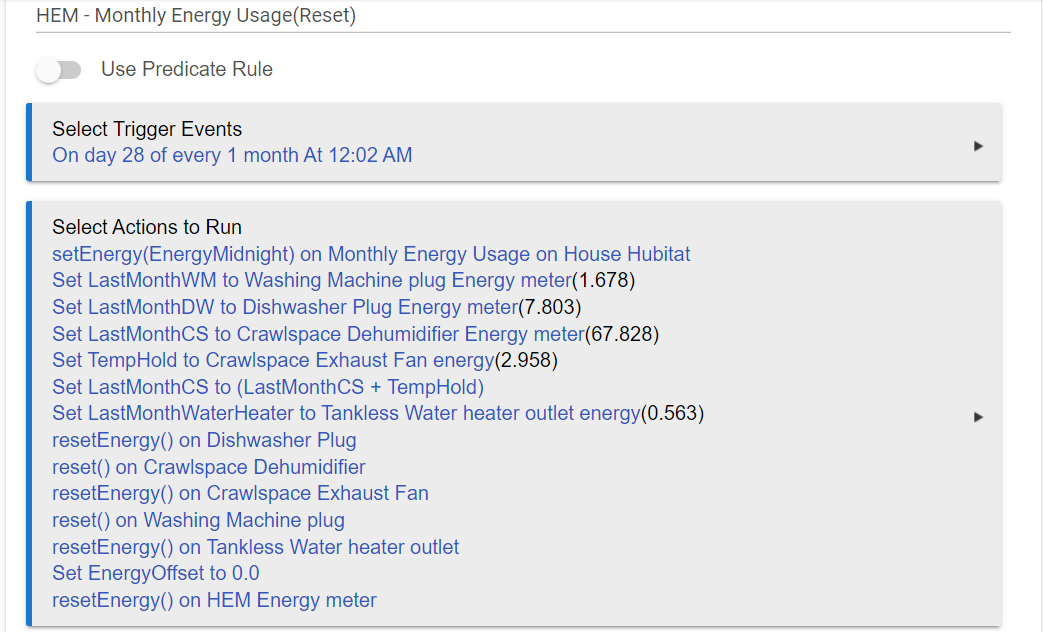
The following routine sets the current energy levels into local variables that I can go back and look at. Then resets the devices. It's a custom action of the energy device.
A driver custom action reset / resetEnergy (when available) makes life much easier when it comes to visualizing the daily or monthly energy consumption in a chart.
For example, see my RM rule for a single device (link) which is much more complicated than terminal3's rule above,