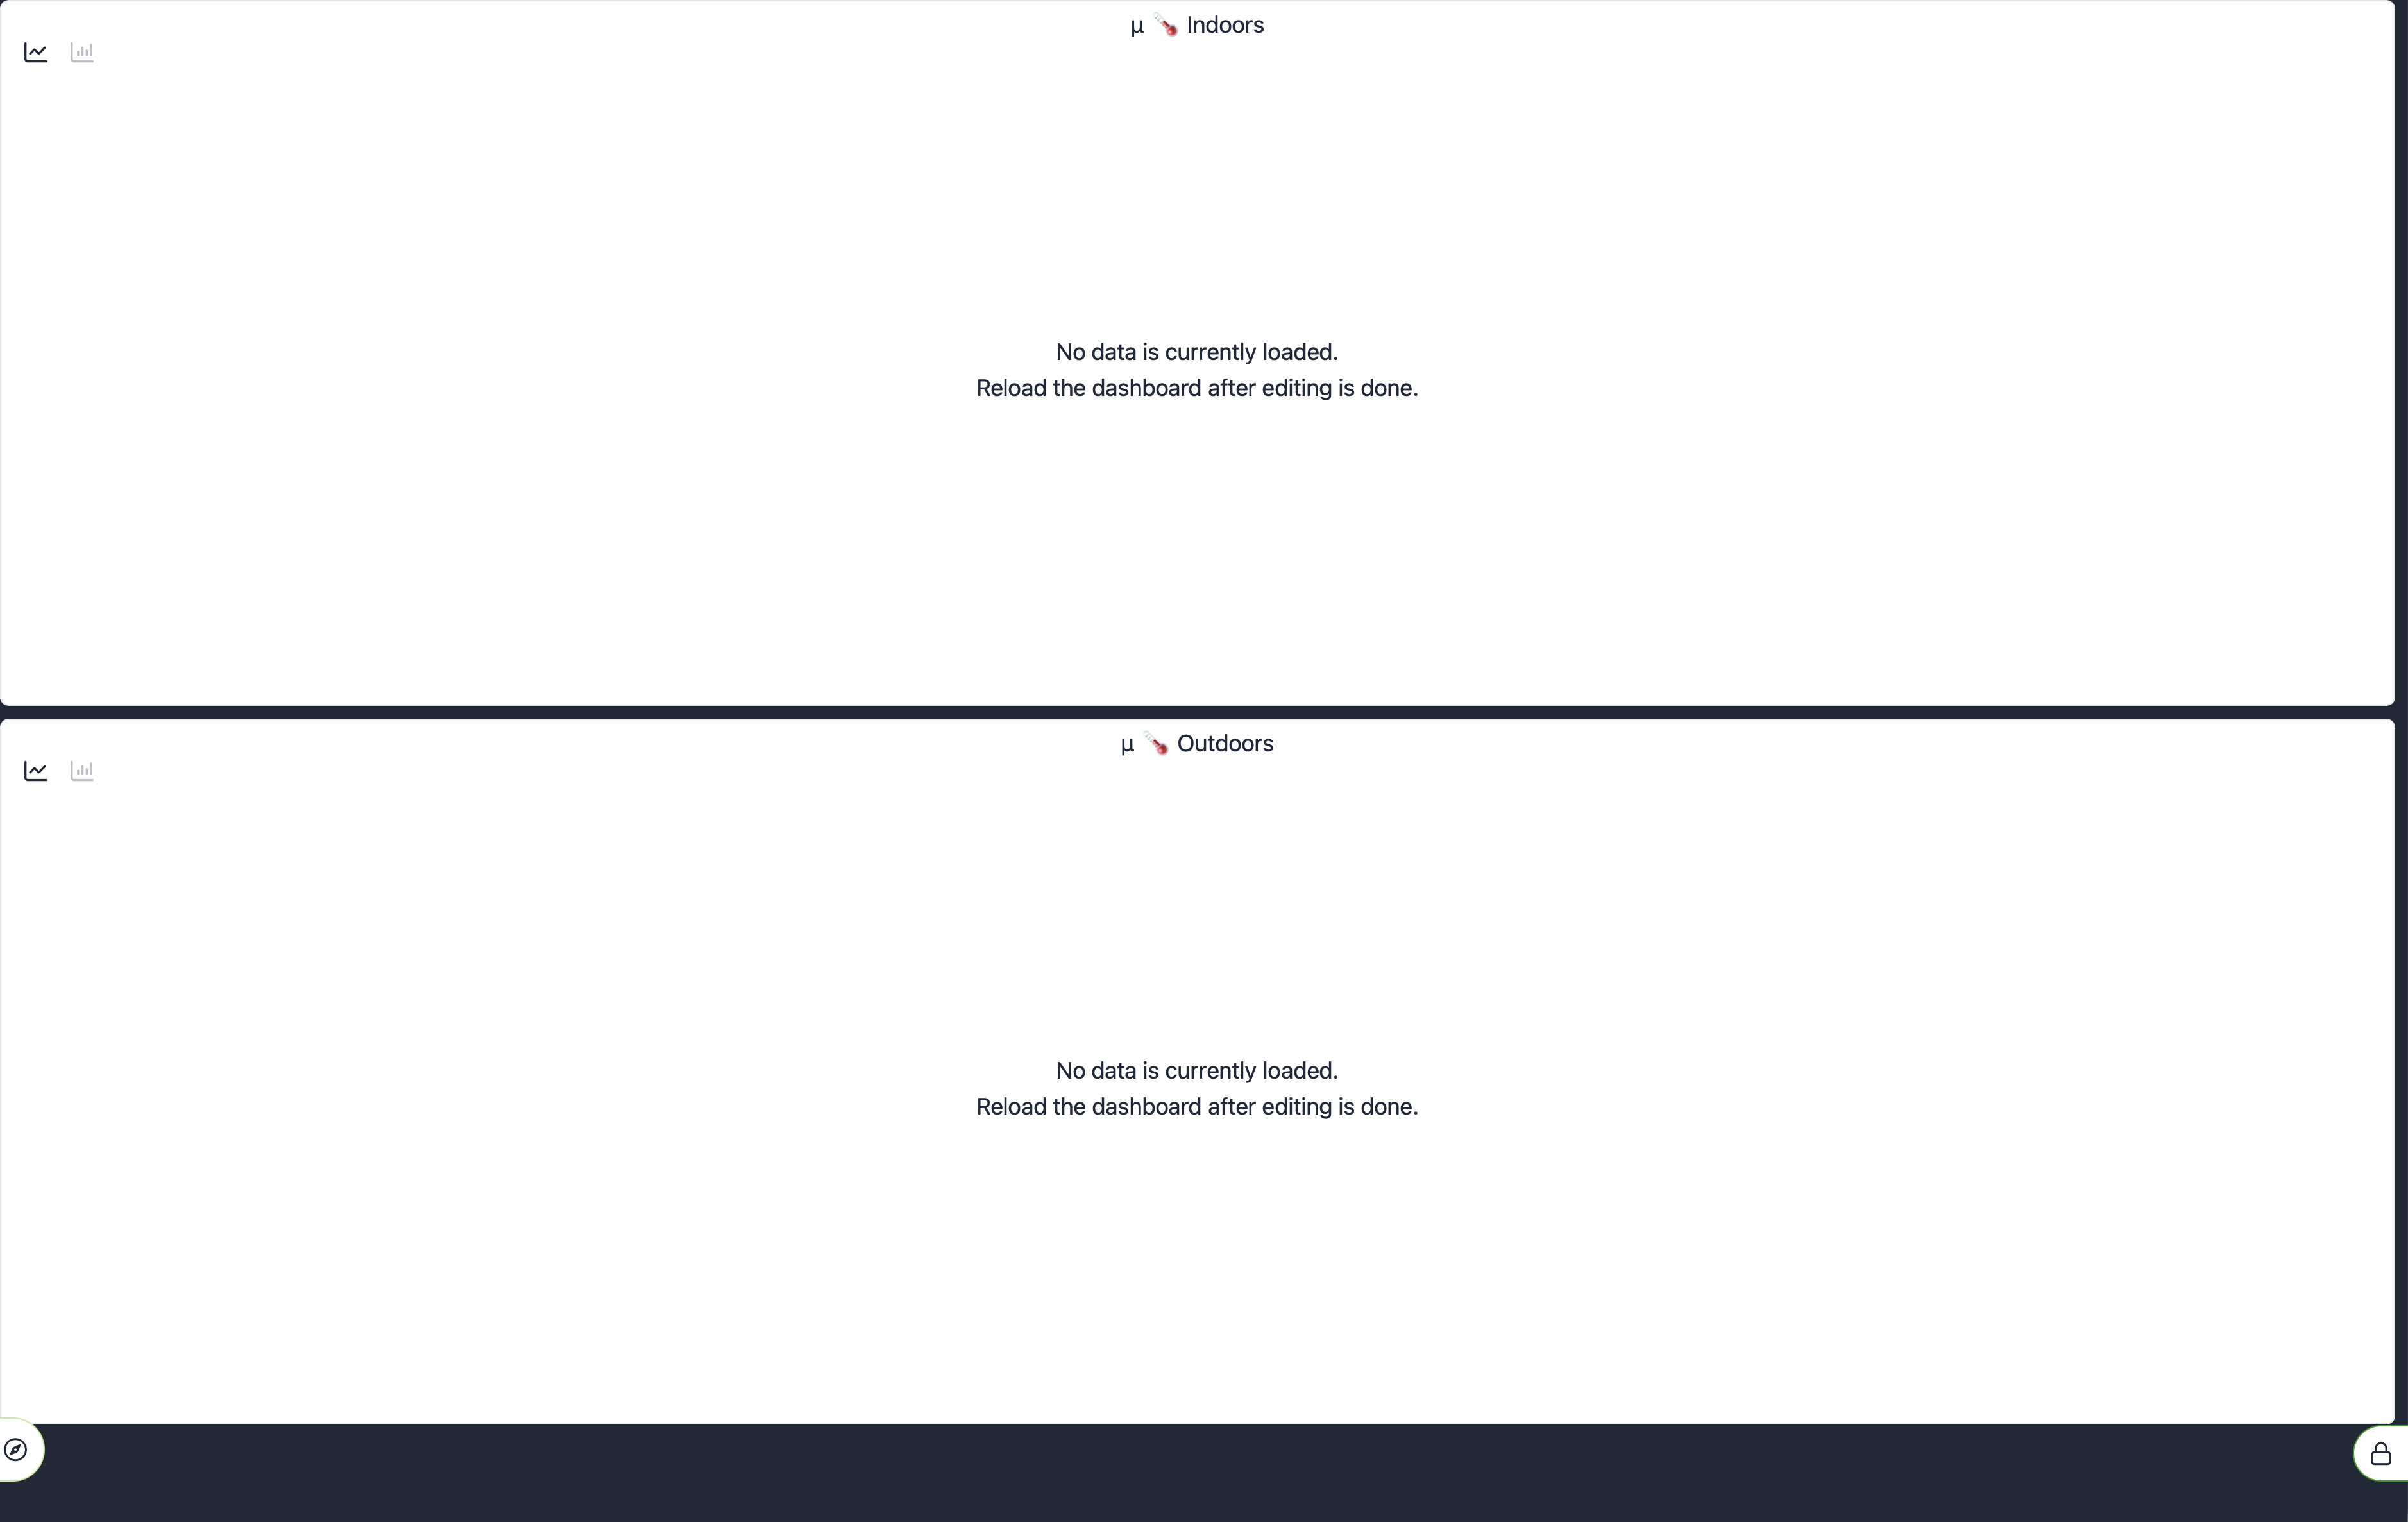
What am I missing? Added a couple of virtual temperature sensors that average the indoor or outdoor temperatures from several actual sensors. Attempting to creagte a graph with them and all I get is this.
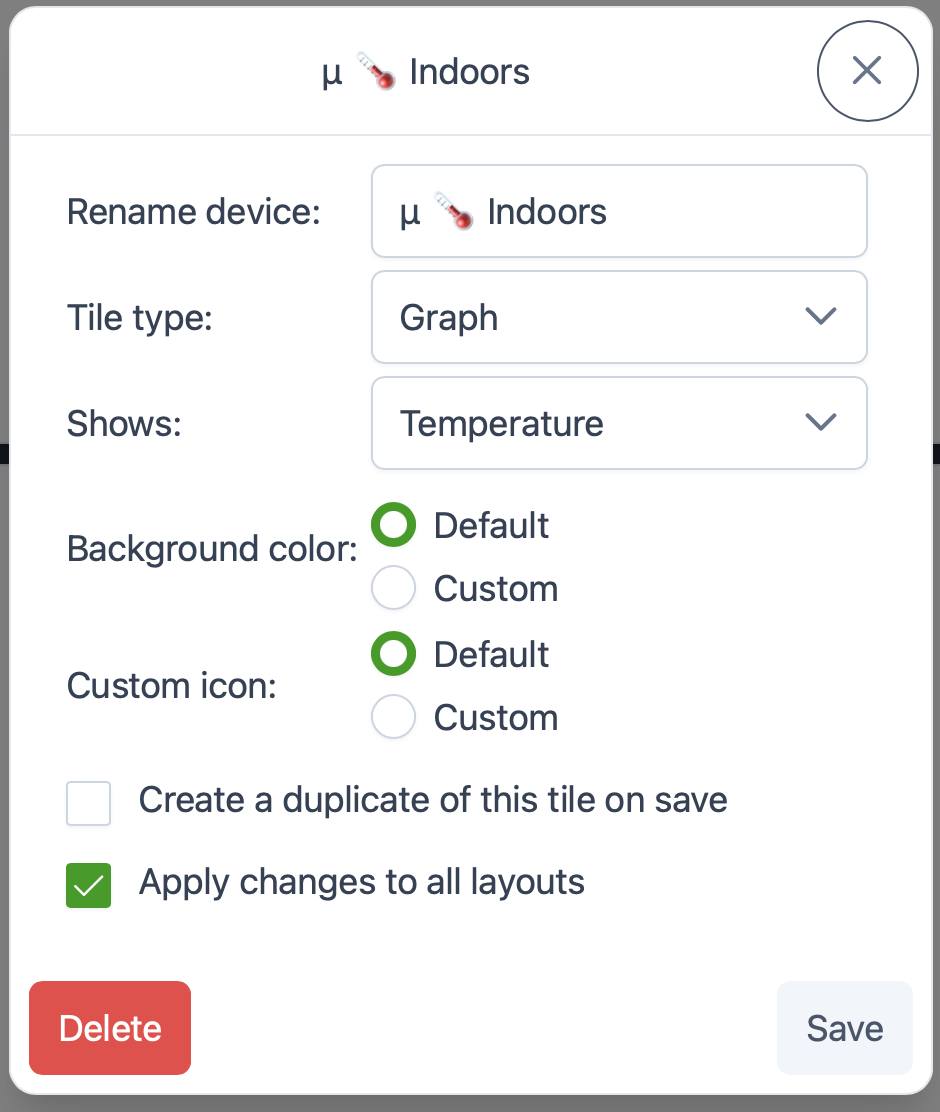
Here is how they are configured:
What am I missing? Added a couple of virtual temperature sensors that average the indoor or outdoor temperatures from several actual sensors. Attempting to creagte a graph with them and all I get is this.
Here is how they are configured:
Can you PM me the hub id? I'll check it out.
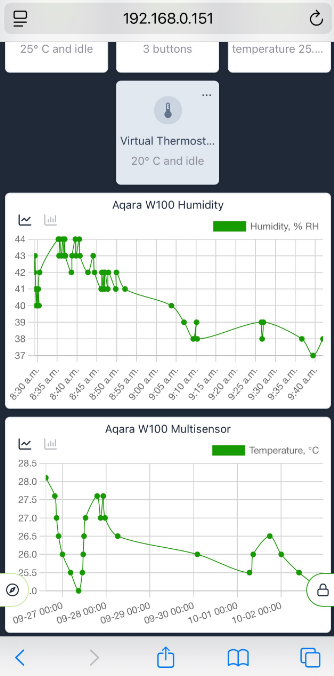
I am trying to use the new ez dashboard graph feature and the device I have is the Nuheat Signature Thermostat. When I try to set up a single EZ dashboard tile with the graph function for temperature, it doesn't work. Tile stays blank and says no data available.
I've also pm'd you my hub id.
any plans to add this to legacy dashboards which unfort. is still more powerfull than the new easy db?
It would be nice to see it available in other contexts as well... Such as on the Device Details page.... Maybe as a pop-up linked from specific types of attributes...
oh boy... in for a penny, in for a pound ![]()
Does it mean ‘Yes’ ? ![]()
It's a gold plated shmaybe.
I know it's super new still and I'm happy the Hubitat team has started to develop graphing natively! Wondering if multi-axis graphs can be put on the future feature list? For example, multisensors for temp/humidity as y1&y2 or multiple series on 1 chart (Temp1, Temp2, Temp3), possibly averaging the data in variable intervals (30 mins, hour, etc). Thanks for your continued development!
Still not working for virtual devices. At lest mine.
Newest beta fixed the issue. Thanks Victor! @gopher.ny
Gold-plated shmaybe? So… Schrödinger’s Yes — hopefully just a few HE updates away.?![]()
Thank you for all your work Victor, we really appreciate it! ![]()
Shthankyou.... ![]()
@bobbyD and the rest of the Hubitat crew: This graphing feature is the best Hubitat improvement in the nearly 4 years I've owned mine. This is so incredibly awesome. Am using it already and so looking forward to continued development & use.
THANK YOU!
@calinatl your comment sounded a bit hyperbolic when I read it, but now I’ve had a play around with this feature I think I agree!
Two issues:
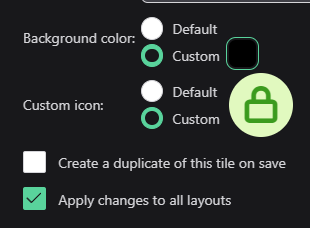
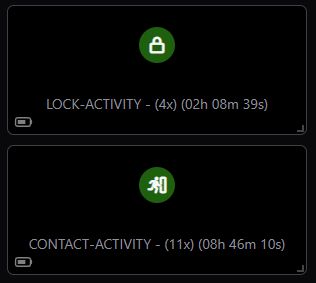
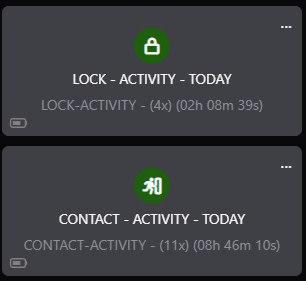
Noticed a bug maybe on the graph's when you set the tile to black
The text also goes black .. not white.
Has anyone else experienced the issue I described in item 2 above?
Wondering if I just need to rebuild this entire dashboard or do I wait for an update?
ETA: +12 days after post #2: Still have same issue. Rebuilt the dashboard.
This topic was automatically closed 90 days after the last reply. New replies are no longer allowed.