I'm just moving stuff over from Smartthings. I have two Dome outlets that also monitor pwr. In the web interface, I can see the outlet and how much power it using but in the mobile app, I can only turn it on and off. Any way to see the pwr as well
Rick
Sort of; the "Lights/Switches" tabs in the mobile app (formerly "Devices" if you see references to that, not to be confused with the same-named sidebar item in the hub admin UI) only allows certain types of control over certain types of devices, as the name hints. This is a relatively new feature in the history of the platform, and it's possible its capabilities will expand over time.
In the meantime, you can do what has worked since before this feature existed: create a Hubitat Dashboard and add your device to it, likely with the Power Meter template for that tile (or whatever template meets your needs). The mobile app provides an easy way to get to Hubitat Dashboards via the "Dashboards" tab, though there's no need to use it just for this if you don't want to; they are just web pages that can be access with any browser using either the LAN or cloud links, depending on your needs -- but the app does make it easier in that you don't need to have these links (which were the only option before the app existed; unlike ST, it's a completely optional part of the Hubitat experience, though it does provide a couple features that make things easier).
If you aren't familiar with Hubitat Dashboard, I might start with: Hubitat® Dashboard | Hubitat Documentation
1 Like
OK on the mobile app under the dashboard I have changed the device to a template that is "power meter" this now shows the pwr used on the device's tile but I can't turn the plug on or off.
I have another problem (maybe) I have created a dashboard for every room. When I click on the dashboard I want it takes 22 seconds to open.
You will probably want two tiles, one for device control, and the other to display the power. Power meter tile is exactly what it says, it isn't for controlling, just for viewing.
That isn't normal. Did you expose all devices to every dashboard, or only the ones that are in use for a particular dashboard?
Is that the same for lets say a motion sensor that monitor's motion,temp and light, would i need a tile for each.
No for eg bedtoom only has devices in it that are in the bedroom. Same with the other dachboards.
That should work using multi-sensor as the template.
Does the hub generally seem quick? Any lag in automations? Errors in the logs?
Ok i think i have the laging dashboards fixed with a hub reboot.
Thanks
Just to recap. Any plug that also monitors power you have to have two tiles one for the power and the other for control
The "mutlisensor" template had, I assume, a SmartThings Multisensor in mind when this template was created. This is a device that is ostensibly largely a contact sensor but also reports temperature and acceleration/physical movement (Lots of devices have multiple sensors built in now; this one was kind of a big deal back in the day for having a few different ones and perhaps some interesting ones at that, PIR motion not being one.)
1 Like
The loading of the dashboards have slowed to a crawl again 20 seconds to load. Looks like a hub reboot solves it but only for 20 minutes or so. Something else must be going on
P.S. if i force close the Hubitat app dashboards load faster but slow down after time.
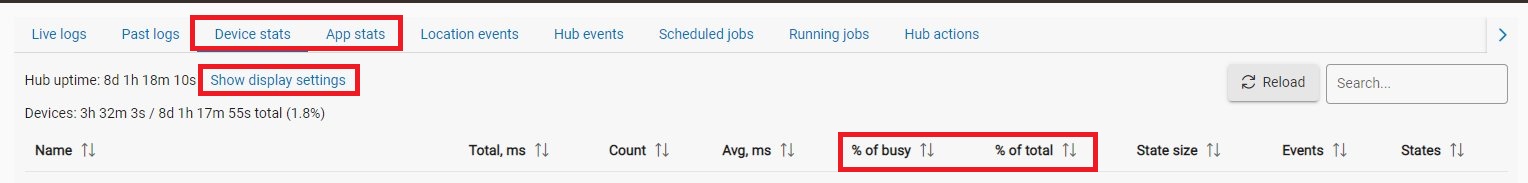
On the hub, go to logs. Tab over to App Stats, and Device Stats. See if anything is consuming a lot of % of busy, or % total time. The other columns might help too, but start with those two and see if there is anything obviously taking processor time.
Also look at my Device Stats Devices: 3h 32m 3s / 8d 1h 17m 55s total (1.8%) and App States Local apps: 2h 1m 39s / 8d 1h 17m 30s total (1.0%) Yours should be similarly low if everything is in good shape. I don't know if there is an exact number, but you probably shouldn't see anything in the double digit percentages here.
I can't remember what columns are visible by default, but I just turn them all on in the settings here.
How many devices have you authorized for your dashboard?
All devices? Or only those devices that are used on that dashboard?
Thanks for the help I was waiting until it slowed down again but it never happened.
This topic was automatically closed 365 days after the last reply. New replies are no longer allowed.

